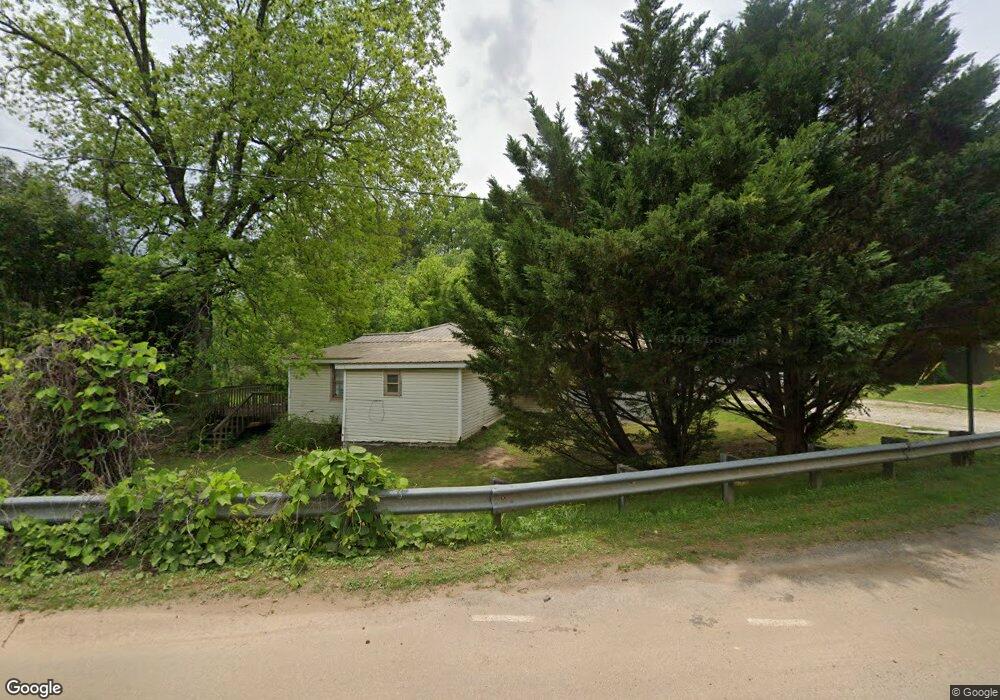
2692 Fortner Rd Ball Ground, GA 30107
Estimated Value: $218,000 - $540,000
--
Bed
1
Bath
2,044
Sq Ft
$156/Sq Ft
Est. Value
About This Home
This home is located at 2692 Fortner Rd, Ball Ground, GA 30107 and is currently estimated at $318,850, approximately $155 per square foot. 2692 Fortner Rd is a home located in Pickens County with nearby schools including Tate Elementary School, Pickens County Middle School, and Pickens County High School.
Ownership History
Date
Name
Owned For
Owner Type
Purchase Details
Closed on
May 20, 2025
Sold by
Abernathy Wynell Foster
Bought by
Palmer Ramey Marianne
Current Estimated Value
Purchase Details
Closed on
Oct 25, 2018
Sold by
Johnson Kenny Shane
Bought by
Abernathy Wynelle
Home Financials for this Owner
Home Financials are based on the most recent Mortgage that was taken out on this home.
Original Mortgage
$14,190
Interest Rate
4.7%
Mortgage Type
New Conventional
Purchase Details
Closed on
Aug 20, 2018
Sold by
Abernathy Wynell Foster
Bought by
Johnson Kenny Shane
Purchase Details
Closed on
Jan 20, 2006
Sold by
Not Provided
Bought by
Abernathy Wynell Foster
Purchase Details
Closed on
Feb 27, 1986
Bought by
Johnson Charles and Johnson Ruth
Purchase Details
Closed on
Feb 26, 1986
Bought by
Foster Wilburn
Purchase Details
Closed on
Jan 1, 1962
Bought by
Parker Hardy and Mary Jane
Create a Home Valuation Report for This Property
The Home Valuation Report is an in-depth analysis detailing your home's value as well as a comparison with similar homes in the area
Home Values in the Area
Average Home Value in this Area
Purchase History
| Date | Buyer | Sale Price | Title Company |
|---|---|---|---|
| Palmer Ramey Marianne | -- | -- | |
| Abernathy Wynelle | -- | -- | |
| Johnson Kenny Shane | -- | -- | |
| Abernathy Wynell Foster | -- | -- | |
| Johnson Charles | $4,500 | -- | |
| Foster Wilburn | $15,000 | -- | |
| Parker Hardy | -- | -- |
Source: Public Records
Mortgage History
| Date | Status | Borrower | Loan Amount |
|---|---|---|---|
| Previous Owner | Abernathy Wynelle | $14,190 |
Source: Public Records
Tax History Compared to Growth
Tax History
| Year | Tax Paid | Tax Assessment Tax Assessment Total Assessment is a certain percentage of the fair market value that is determined by local assessors to be the total taxable value of land and additions on the property. | Land | Improvement |
|---|---|---|---|---|
| 2024 | $1,578 | $79,724 | $9,733 | $69,991 |
| 2023 | $1,132 | $55,662 | $9,733 | $45,929 |
| 2022 | $1,132 | $55,662 | $9,733 | $45,929 |
| 2021 | $317 | $14,530 | $4,204 | $10,326 |
| 2020 | $326 | $14,530 | $4,204 | $10,326 |
| 2019 | $334 | $14,530 | $4,204 | $10,326 |
| 2018 | $337 | $14,530 | $4,204 | $10,326 |
| 2017 | $342 | $14,530 | $4,204 | $10,326 |
| 2016 | $344 | $14,368 | $4,042 | $10,326 |
| 2015 | $336 | $14,368 | $4,042 | $10,326 |
| 2014 | $337 | $14,368 | $4,042 | $10,326 |
| 2013 | -- | $14,368 | $4,042 | $10,326 |
Source: Public Records
Map
Nearby Homes
- 0 Fortner Rd Unit 7602037
- 458 Cherokee Wood Hollow
- 497 Cherokee Trail
- 960 Oxford Rd
- 388 Oxford Rd
- 359 Oxford Rd
- 575 Cherokee Forest Park Dr
- 354 Oxford Rd
- 415 London Rd
- 329 Oxford Rd
- 394 Settlers Ridge Dr
- 22 Limestone Trail
- 350 Pea Ridge Rd
- 1740 Four Mile Church Rd
- 1740 4 Mile Church Rd
- 4573 Fortner Rd
- 2168 Fortner Rd
- 2659 Fortner Rd
- 2640 Fortner Rd
- 0 Fortner Rd
- 00 Fortner Rd
- 0 Fortner Rd Unit 10318173
- 0 Fortner Rd Unit 7403415
- 0 Fortner Rd Unit 241621
- 0 Fortner Rd Unit 241086
- 0 Fortner Rd Unit 10094128
- 0 Fortner Rd Unit 7117328
- 0 Fortner Rd Unit 8778436
- 0 Fortner Rd Unit 8627340
- 0 Fortner Rd Unit 8326785
- 2674 Fortner Rd
- 2626 Fortner Rd
- 2612 Fortner Rd
- 2012 Harrington Rd
- 36 Buckshot Trail
- 2861 Fortner Rd