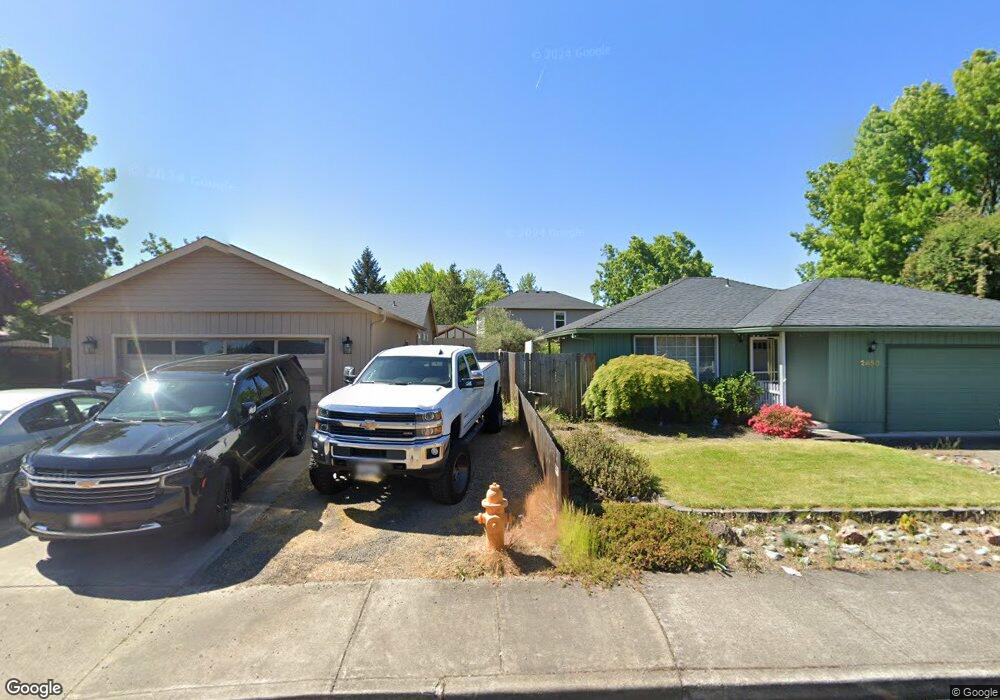
2693 E McAndrews Rd Medford, OR 97504
Estimated Value: $447,000 - $598,000
3
Beds
2
Baths
1,496
Sq Ft
$358/Sq Ft
Est. Value
About This Home
This home is located at 2693 E McAndrews Rd, Medford, OR 97504 and is currently estimated at $535,419, approximately $357 per square foot. 2693 E McAndrews Rd is a home located in Jackson County with nearby schools including Lone Pine Elementary School, Hedrick Middle School, and North Medford High School.
Ownership History
Date
Name
Owned For
Owner Type
Purchase Details
Closed on
Mar 5, 1998
Sold by
Armond Debra Ann
Bought by
Schoenmann David W and Schoenmann Sherri A
Current Estimated Value
Home Financials for this Owner
Home Financials are based on the most recent Mortgage that was taken out on this home.
Original Mortgage
$124,450
Outstanding Balance
$22,706
Interest Rate
6.99%
Estimated Equity
$512,713
Purchase Details
Closed on
Nov 6, 1997
Sold by
Wessling Everett M and Wessling Joan E
Bought by
Armond Debra Ann
Home Financials for this Owner
Home Financials are based on the most recent Mortgage that was taken out on this home.
Original Mortgage
$99,000
Interest Rate
7.26%
Create a Home Valuation Report for This Property
The Home Valuation Report is an in-depth analysis detailing your home's value as well as a comparison with similar homes in the area
Home Values in the Area
Average Home Value in this Area
Purchase History
| Date | Buyer | Sale Price | Title Company |
|---|---|---|---|
| Schoenmann David W | $131,000 | Key Title Company | |
| Armond Debra Ann | $132,000 | Key Title Company |
Source: Public Records
Mortgage History
| Date | Status | Borrower | Loan Amount |
|---|---|---|---|
| Open | Schoenmann David W | $124,450 | |
| Previous Owner | Armond Debra Ann | $99,000 |
Source: Public Records
Tax History Compared to Growth
Tax History
| Year | Tax Paid | Tax Assessment Tax Assessment Total Assessment is a certain percentage of the fair market value that is determined by local assessors to be the total taxable value of land and additions on the property. | Land | Improvement |
|---|---|---|---|---|
| 2025 | $5,249 | $361,920 | $157,310 | $204,610 |
| 2024 | $5,249 | $351,380 | $152,730 | $198,650 |
| 2023 | $5,088 | $341,150 | $148,290 | $192,860 |
| 2022 | $4,964 | $341,150 | $148,290 | $192,860 |
| 2021 | $4,836 | $331,220 | $143,980 | $187,240 |
| 2020 | $4,733 | $321,580 | $139,790 | $181,790 |
| 2019 | $4,622 | $303,130 | $131,780 | $171,350 |
| 2018 | $4,503 | $294,310 | $127,940 | $166,370 |
| 2017 | $4,422 | $294,310 | $127,940 | $166,370 |
| 2016 | $4,451 | $277,420 | $120,590 | $156,830 |
| 2015 | $4,278 | $277,420 | $120,590 | $156,830 |
| 2014 | $4,203 | $261,500 | $113,660 | $147,840 |
Source: Public Records
Map
Nearby Homes
- 1258 Paulita Dr
- 1759 Carrera Cir
- 1813 Cascadia Cir
- 1224 N Modoc Ave Unit 57
- 1569 Papago Dr
- 1841 Cascadia Cir
- 1277 Gardendale Ave
- 1928 Hannah Ln
- 1501 Brookdale Ave
- 889 Valley View Dr
- 1460 Brookdale Ave
- 2777 Roberts Rd
- 1089 Brookdale Ave
- 1472 N Keene Way Dr
- 2020 Ridge Way
- 2327 Derry Ct
- 1560 Cambridge Cir
- 1467 Spring St
- 2055 Campus Dr Unit 1 - 4
- 2080 College Way
- 2701 E McAndrews Rd
- 2653 E McAndrews Rd
- 2660 Montara Dr
- 2650 Montara Dr
- 2719/2723 E McAndrews Rd
- 2640 Montara Dr
- 2719 E McAndrews Rd
- 2630 Montara Dr
- 2668 Montara Dr
- 1323 Severson Dr
- 1349 Severson Dr
- 3090 E McAndrews Rd
- 3098 E McAndrews Rd
- 1523 E McAndrews Rd
- 2715 E McAndrews Rd
- 0 E McAndrews Rd
- 2735 E McAndrews Rd
- 2651 Montara Dr
- 1367 Severson Dr
- 2600 E McAndrews Rd