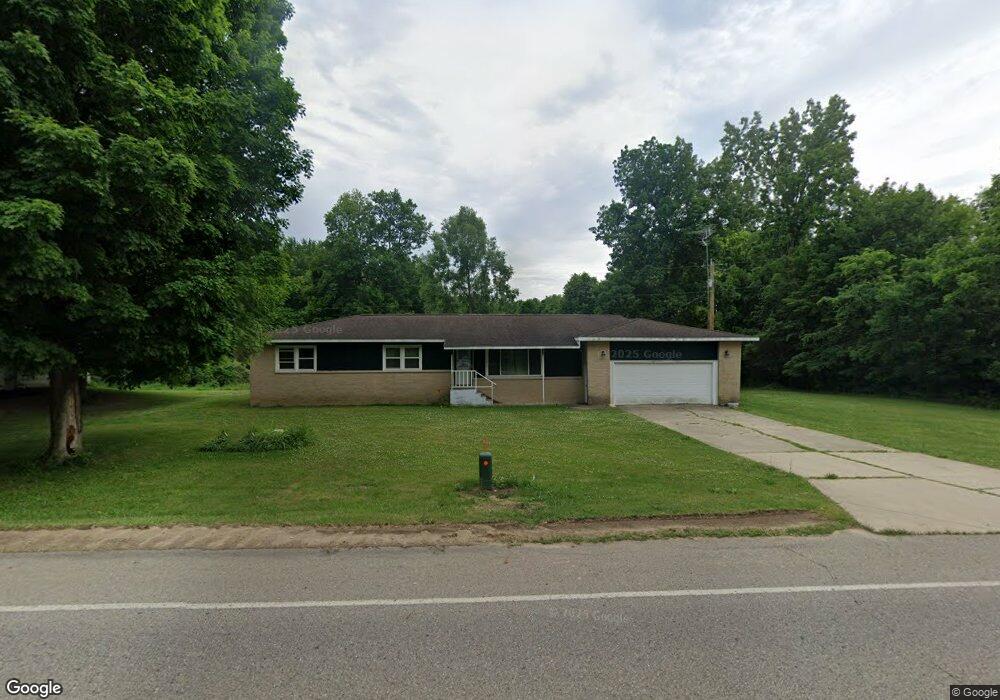
2694 114th Ave Allegan, MI 49010
Estimated Value: $305,000 - $399,000
3
Beds
2
Baths
1,512
Sq Ft
$227/Sq Ft
Est. Value
About This Home
This home is located at 2694 114th Ave, Allegan, MI 49010 and is currently estimated at $343,472, approximately $227 per square foot. 2694 114th Ave is a home located in Allegan County with nearby schools including Pine Trails Elementary School, L.E. White Middle School, and Allegan High School.
Ownership History
Date
Name
Owned For
Owner Type
Purchase Details
Closed on
Aug 30, 2017
Sold by
Gillette Charles Leroy and Gillette Marcia Lynn
Bought by
Gillette Charles Leroy and Gillette Marcia Lynn
Current Estimated Value
Purchase Details
Closed on
Jun 12, 2017
Sold by
Nast Carl F
Bought by
Gillette Charles and Gillett Marcia L
Home Financials for this Owner
Home Financials are based on the most recent Mortgage that was taken out on this home.
Original Mortgage
$156,500
Interest Rate
4.05%
Purchase Details
Closed on
Dec 17, 2015
Sold by
Nast Carl F
Bought by
Nast Carl F
Purchase Details
Closed on
Jul 28, 1995
Bought by
Nast
Create a Home Valuation Report for This Property
The Home Valuation Report is an in-depth analysis detailing your home's value as well as a comparison with similar homes in the area
Home Values in the Area
Average Home Value in this Area
Purchase History
| Date | Buyer | Sale Price | Title Company |
|---|---|---|---|
| Gillette Charles Leroy | -- | Attorney | |
| Gillette Charles | $165,000 | Attorneys Title Agency Of So | |
| Nast Carl F | -- | Attorney | |
| Nast | $110,000 | -- |
Source: Public Records
Mortgage History
| Date | Status | Borrower | Loan Amount |
|---|---|---|---|
| Previous Owner | Gillette Charles | $156,500 |
Source: Public Records
Tax History Compared to Growth
Tax History
| Year | Tax Paid | Tax Assessment Tax Assessment Total Assessment is a certain percentage of the fair market value that is determined by local assessors to be the total taxable value of land and additions on the property. | Land | Improvement |
|---|---|---|---|---|
| 2025 | $3,746 | $158,800 | $40,000 | $118,800 |
| 2024 | $3,404 | $150,100 | $37,500 | $112,600 |
| 2023 | $3,404 | $130,100 | $30,000 | $100,100 |
| 2022 | $3,404 | $115,700 | $29,000 | $86,700 |
| 2021 | $3,164 | $109,300 | $27,500 | $81,800 |
| 2020 | $3,164 | $100,800 | $26,700 | $74,100 |
| 2019 | $0 | $96,400 | $24,200 | $72,200 |
| 2018 | $0 | $92,700 | $25,500 | $67,200 |
| 2017 | $0 | $88,000 | $26,000 | $62,000 |
| 2016 | $0 | $82,200 | $24,000 | $58,200 |
| 2015 | -- | $82,200 | $24,000 | $58,200 |
| 2014 | -- | $77,100 | $23,900 | $53,200 |
| 2013 | -- | $76,800 | $24,000 | $52,800 |
Source: Public Records
Map
Nearby Homes