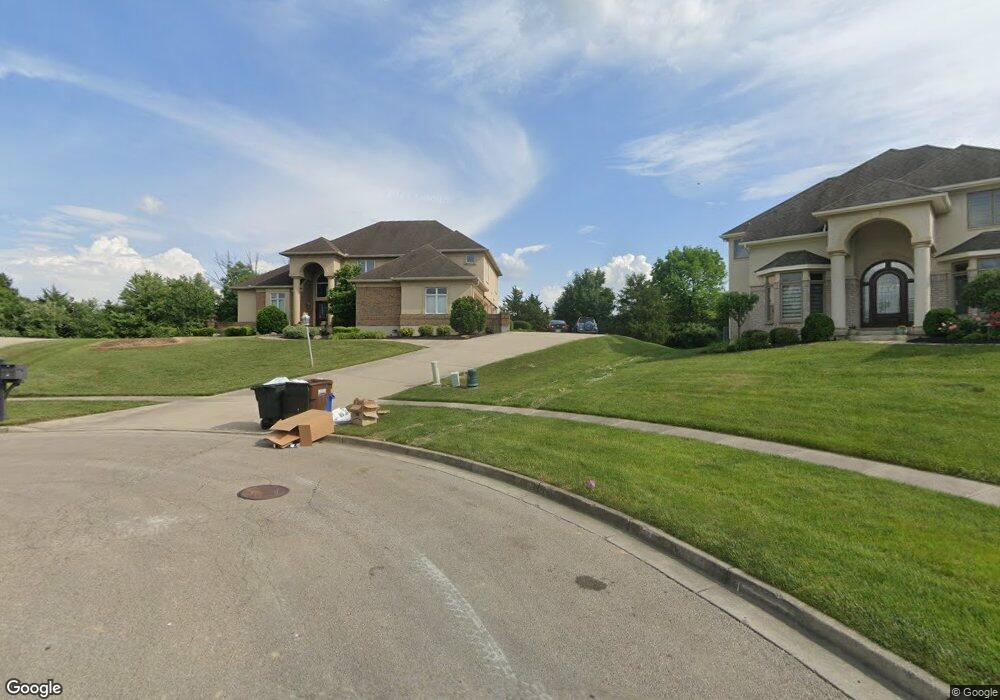
2694 Bent Creek Ct Beavercreek, OH 45431
Estimated Value: $736,000 - $813,321
5
Beds
5
Baths
5,852
Sq Ft
$134/Sq Ft
Est. Value
About This Home
This home is located at 2694 Bent Creek Ct, Beavercreek, OH 45431 and is currently estimated at $781,330, approximately $133 per square foot. 2694 Bent Creek Ct is a home located in Greene County with nearby schools including Main Elementary School, Jacob Coy Middle School, and Beavercreek High School.
Ownership History
Date
Name
Owned For
Owner Type
Purchase Details
Closed on
Sep 16, 2021
Sold by
Board Of Trustees Of Beavercreek Townshi
Bought by
Nhr Trucking Llc
Current Estimated Value
Purchase Details
Closed on
Sep 30, 2015
Sold by
Fooksman Susan T
Bought by
Ten George A
Home Financials for this Owner
Home Financials are based on the most recent Mortgage that was taken out on this home.
Original Mortgage
$542,010
Interest Rate
3.84%
Mortgage Type
VA
Purchase Details
Closed on
Apr 16, 2010
Sold by
Fooksman Marc A and Fooksman Susan T
Bought by
Fooksman Susan T and Susan T Fooksman Revocable Living Trust
Purchase Details
Closed on
Apr 16, 2007
Sold by
Bcgolf Lp
Bought by
Fooksman Marc A and Fooksman Susan T
Home Financials for this Owner
Home Financials are based on the most recent Mortgage that was taken out on this home.
Original Mortgage
$590,052
Interest Rate
6.18%
Mortgage Type
Construction
Create a Home Valuation Report for This Property
The Home Valuation Report is an in-depth analysis detailing your home's value as well as a comparison with similar homes in the area
Home Values in the Area
Average Home Value in this Area
Purchase History
| Date | Buyer | Sale Price | Title Company |
|---|---|---|---|
| Nhr Trucking Llc | $85,501 | None Available | |
| Ten George A | $575,000 | Home Services Title Llc | |
| Fooksman Susan T | -- | Attorney | |
| Fooksman Marc A | $135,500 | None Available |
Source: Public Records
Mortgage History
| Date | Status | Borrower | Loan Amount |
|---|---|---|---|
| Previous Owner | Ten George A | $542,010 | |
| Previous Owner | Fooksman Marc A | $590,052 |
Source: Public Records
Tax History Compared to Growth
Tax History
| Year | Tax Paid | Tax Assessment Tax Assessment Total Assessment is a certain percentage of the fair market value that is determined by local assessors to be the total taxable value of land and additions on the property. | Land | Improvement |
|---|---|---|---|---|
| 2024 | $17,443 | $267,170 | $29,520 | $237,650 |
| 2023 | $17,443 | $267,170 | $29,520 | $237,650 |
| 2022 | $16,475 | $222,770 | $29,520 | $193,250 |
| 2021 | $16,141 | $222,770 | $29,520 | $193,250 |
| 2020 | $16,262 | $222,770 | $29,520 | $193,250 |
| 2019 | $16,829 | $210,440 | $34,250 | $176,190 |
| 2018 | $14,853 | $210,440 | $34,250 | $176,190 |
| 2017 | $15,493 | $210,440 | $34,250 | $176,190 |
| 2016 | $15,494 | $207,760 | $34,250 | $173,510 |
| 2015 | $15,093 | $207,760 | $34,250 | $173,510 |
| 2014 | $14,845 | $207,760 | $34,250 | $173,510 |
Source: Public Records
Map
Nearby Homes
- 2715 Golden Leaf Dr Unit 19-204
- 2727 Golden Leaf Dr Unit 18-300
- 2735 Golden Leaf Dr Unit 18-202
- 2741 Golden Leaf Dr Unit 18-203
- Beckett Plan at Bent Creek Woods - Masterpiece Collection
- Margot Plan at Bent Creek Woods - Masterpiece Collection
- Winslow Plan at Bent Creek Woods - Masterpiece Collection
- Rhodes Plan at Bent Creek Woods - Masterpiece Collection
- Leland Plan at Bent Creek Woods - Masterpiece Collection
- Stanton Plan at Bent Creek Woods - Masterpiece Collection
- Huxley Plan at Bent Creek Woods - Masterpiece Collection
- Paxton Plan at Bent Creek Woods - Masterpiece Collection
- Pearson Plan at Bent Creek Woods - Masterpiece Collection
- Clay Plan at Bent Creek Woods - Masterpiece Collection
- 2707 Golden Leaf Dr Unit 19-305
- 2749 Golden Leaf Dr Unit 18-305
- 2649 Golden Leaf Dr Unit 16-300
- 2669 Golden Leaf Dr Unit 16-305
- 2490 Bent Grass Dr
- 2481 Bent Grass Dr
- 2695 Bent Creek Ct
- 2704 Bent Creek Ct
- 2714 Bent Creek Ct Unit 36684863
- 2714 Bent Creek Ct Unit 36684864
- 2714 Bent Creek Ct Unit 36684760
- 2714 Bent Creek Ct Unit 36684739
- 2714 Bent Creek Ct Unit 36684698
- 2714 Bent Creek Ct Unit 36658362
- 2714 Bent Creek Ct Unit 36658363
- 2714 Bent Creek Ct Unit 36658365
- 2714 Bent Creek Ct Unit 36658361
- 2649 Golden Leaf Dr
- 2714 Bent Creek Ct
- 2766 Bent Grass Dr
- 0 Bent Creek Ct Unit 454187
- 0 Bent Creek Ct Unit 454185
- 2669 Greenside Dr Unit 122
- 2663 Greenside Dr Unit 121
- 2724 Bent Creek Ct
- 2657 Greenside Dr Unit 114