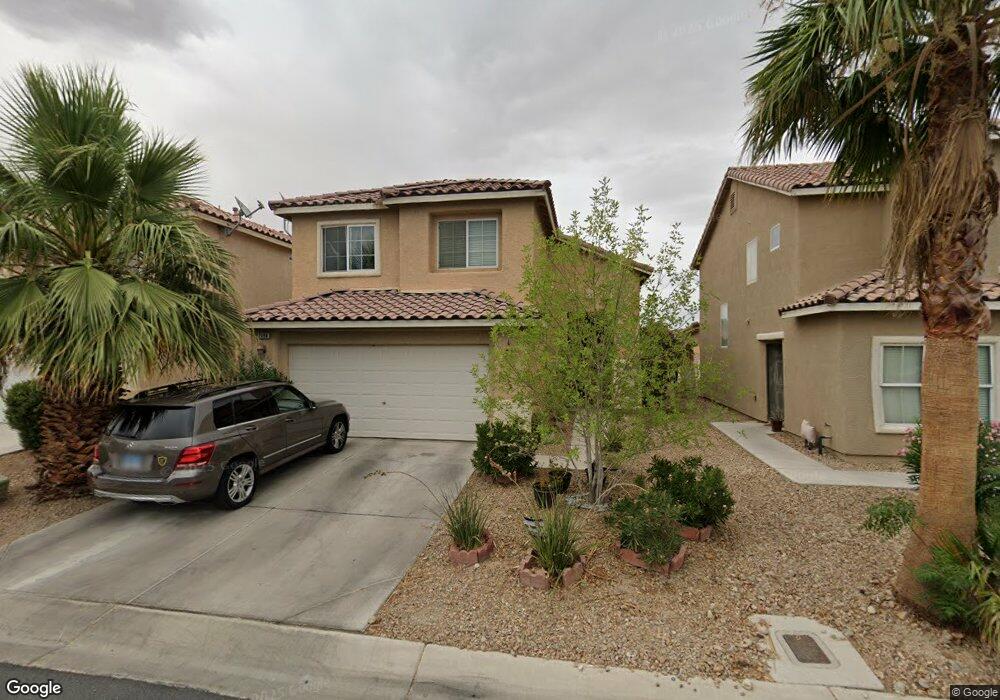
2694 Morning Break Ct Las Vegas, NV 89142
Estimated Value: $402,420 - $431,000
4
Beds
3
Baths
1,886
Sq Ft
$220/Sq Ft
Est. Value
About This Home
This home is located at 2694 Morning Break Ct, Las Vegas, NV 89142 and is currently estimated at $414,605, approximately $219 per square foot. 2694 Morning Break Ct is a home located in Clark County with nearby schools including John F. Mendoza Elementary School, Duane D. Keller Middle School, and Las Vegas High School.
Ownership History
Date
Name
Owned For
Owner Type
Purchase Details
Closed on
Oct 15, 2018
Sold by
Jimenez Jona T
Bought by
Jimenez Orlando F and Jimenez Jona T
Current Estimated Value
Purchase Details
Closed on
Jun 16, 2004
Sold by
Jimenez Orlando F
Bought by
Jimenez Jona T
Home Financials for this Owner
Home Financials are based on the most recent Mortgage that was taken out on this home.
Original Mortgage
$202,750
Interest Rate
6.29%
Mortgage Type
Unknown
Purchase Details
Closed on
Jun 14, 2004
Sold by
Richmond American Homes Of Nevada Inc
Bought by
Jimenez Jona T
Home Financials for this Owner
Home Financials are based on the most recent Mortgage that was taken out on this home.
Original Mortgage
$202,750
Interest Rate
6.29%
Mortgage Type
Unknown
Create a Home Valuation Report for This Property
The Home Valuation Report is an in-depth analysis detailing your home's value as well as a comparison with similar homes in the area
Home Values in the Area
Average Home Value in this Area
Purchase History
| Date | Buyer | Sale Price | Title Company |
|---|---|---|---|
| Jimenez Orlando F | -- | None Available | |
| Jimenez Jona T | -- | First American Title Co Of | |
| Jimenez Jona T | $253,470 | First American Title Co Of |
Source: Public Records
Mortgage History
| Date | Status | Borrower | Loan Amount |
|---|---|---|---|
| Previous Owner | Jimenez Jona T | $202,750 | |
| Closed | Jimenez Jona T | $38,000 |
Source: Public Records
Tax History Compared to Growth
Tax History
| Year | Tax Paid | Tax Assessment Tax Assessment Total Assessment is a certain percentage of the fair market value that is determined by local assessors to be the total taxable value of land and additions on the property. | Land | Improvement |
|---|---|---|---|---|
| 2025 | $1,238 | $98,772 | $24,150 | $74,622 |
| 2024 | $1,202 | $98,772 | $24,150 | $74,622 |
| 2023 | $1,202 | $97,418 | $26,950 | $70,468 |
| 2022 | $1,168 | $87,744 | $23,450 | $64,294 |
| 2021 | $1,134 | $81,044 | $19,950 | $61,094 |
| 2020 | $1,098 | $80,376 | $19,950 | $60,426 |
| 2019 | $1,066 | $76,949 | $17,500 | $59,449 |
| 2018 | $1,035 | $69,426 | $12,600 | $56,826 |
| 2017 | $1,951 | $66,528 | $11,900 | $54,628 |
| 2016 | $981 | $51,973 | $8,400 | $43,573 |
| 2015 | $978 | $41,667 | $6,650 | $35,017 |
| 2014 | $949 | $31,404 | $5,250 | $26,154 |
Source: Public Records
Map
Nearby Homes
- 2711 Morning Break Ct
- 5816 Glory Canyon Way
- 5857 Rainbow Bridge Dr
- 5926 Mahogany Mountain Dr
- 5714 Roundrock Dr
- 5783 Typecast Rd
- 5655 E Sahara Ave Unit 2048
- 5655 E Sahara Ave Unit 2009
- 5655 E Sahara Ave Unit 1003
- 5655 E Sahara Ave Unit 2068
- 2937 White Selzter Ct
- 6105 E Sahara Ave Unit 35
- 6105 E Sahara Ave Unit 117
- 6105 E Sahara Ave Unit 166
- 6105 E Sahara Ave Unit 26
- 5650 E Sahara Ave Unit 2010
- 5650 E Sahara Ave Unit 2007
- 5650 E Sahara Ave Unit 1035
- 2949 White Selzter Ct
- 2953 White Selzter Ct
- 2700 Morning Break Ct
- 2688 Morning Break Ct
- 2706 Morning Break Ct
- 2695 Sunrise Day Ct
- 2689 Sunrise Day Ct
- 2701 Sunrise Day Ct
- 2701 Sunrise Day Ct Unit n/a
- 2712 Morning Break Ct
- 2707 Sunrise Day Ct
- 2693 Morning Break Ct
- 2699 Morning Break Ct
- 2687 Morning Break Ct
- 5842 Mahogany Mountain Dr
- 2711 Sunrise Day Ct
- 5836 Mahogany Mountain Dr
- 2718 Morning Break Ct
- 2705 Morning Break Ct
- 5848 Mahogany Mountain Dr
- 5830 Mahogany Mountain Dr
- 5824 Mahogany Mountain Dr