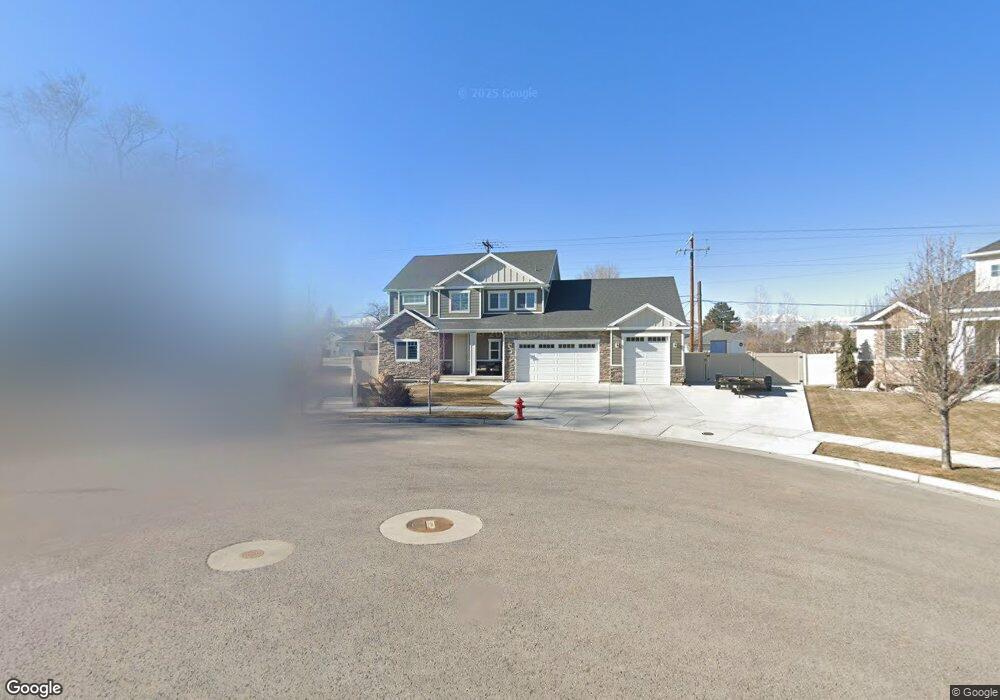
2694 W Closner Cir West Jordan, UT 84088
Estimated Value: $794,000 - $896,642
4
Beds
3
Baths
2,597
Sq Ft
$320/Sq Ft
Est. Value
About This Home
This home is located at 2694 W Closner Cir, West Jordan, UT 84088 and is currently estimated at $830,911, approximately $319 per square foot. 2694 W Closner Cir is a home with nearby schools including Westvale Elementary School, West Jordan Middle School, and West Jordan High School.
Ownership History
Date
Name
Owned For
Owner Type
Purchase Details
Closed on
Aug 27, 2021
Sold by
Chambers Torin and Mandujano Martha
Bought by
Chambers Torin and Mandujano Martha P
Current Estimated Value
Purchase Details
Closed on
Dec 21, 2016
Sold by
Scarbrough Corbin and Giesler Vicki
Bought by
Scarbrough Corbin K and Giesler Vicki
Home Financials for this Owner
Home Financials are based on the most recent Mortgage that was taken out on this home.
Original Mortgage
$384,356
Outstanding Balance
$310,839
Interest Rate
3.57%
Mortgage Type
New Conventional
Estimated Equity
$520,072
Purchase Details
Closed on
Jul 27, 2016
Sold by
Castle Creek Homes South Llc
Bought by
Scarbrough Corbin and Giesler Vicki
Home Financials for this Owner
Home Financials are based on the most recent Mortgage that was taken out on this home.
Original Mortgage
$319,601
Interest Rate
3.54%
Mortgage Type
Commercial
Create a Home Valuation Report for This Property
The Home Valuation Report is an in-depth analysis detailing your home's value as well as a comparison with similar homes in the area
Home Values in the Area
Average Home Value in this Area
Purchase History
| Date | Buyer | Sale Price | Title Company |
|---|---|---|---|
| Chambers Torin | -- | Truly Title Inc | |
| Scarbrough Corbin K | -- | Mountain View Title & Escrow | |
| Scarbrough Corbin | -- | Mountain View Title & Escrow |
Source: Public Records
Mortgage History
| Date | Status | Borrower | Loan Amount |
|---|---|---|---|
| Open | Scarbrough Corbin K | $384,356 | |
| Closed | Scarbrough Corbin | $319,601 |
Source: Public Records
Tax History Compared to Growth
Tax History
| Year | Tax Paid | Tax Assessment Tax Assessment Total Assessment is a certain percentage of the fair market value that is determined by local assessors to be the total taxable value of land and additions on the property. | Land | Improvement |
|---|---|---|---|---|
| 2025 | $4,050 | $839,800 | $174,300 | $665,500 |
| 2024 | $4,050 | $779,300 | $160,800 | $618,500 |
| 2023 | $4,109 | $745,000 | $151,700 | $593,300 |
| 2022 | $4,264 | $760,600 | $148,700 | $611,900 |
| 2021 | $3,620 | $587,800 | $119,900 | $467,900 |
| 2020 | $3,400 | $518,200 | $119,900 | $398,300 |
| 2019 | $3,248 | $485,400 | $119,900 | $365,500 |
| 2018 | $3,102 | $459,800 | $88,000 | $371,800 |
| 2017 | $2,937 | $433,400 | $88,000 | $345,400 |
| 2016 | $1,214 | $92,600 | $92,600 | $0 |
| 2015 | $1,056 | $78,500 | $78,500 | $0 |
Source: Public Records
Map
Nearby Homes
- 48 San Rafael Ct
- 8407 Meadow Green Way
- 77 Rio Bravo Place
- 8461 S 2385 W
- 2497 Bueno Vista Dr
- 3542 W Franco Ct Unit 4
- 4000 W 8400 S Unit 83
- 7968 S 2700 W
- 7993 S 2760 W
- 14 San Miguel St
- 3112 Green Acre Dr
- 8140 S 2245 W
- 8026 Laguna Cir
- 7942 S 2800 W
- 7987 S 2980 W
- 8383 S 2200 W
- 8493 S 3200 W
- 3066 W Linton Dr
- 8886 S 2700 W
- 2970 W 8870 S
- 2688 W Closner Cir
- 8305 S 2700 W
- 8305 S 2700 W
- 2689 W Closner Cir Unit 115
- 2674 W Closner Cir
- 8281 S 2700 W
- 2669 W Closner Cir
- 2671 W Closner Cir
- 2664 W Closner Cir
- 2725 W 8250 S
- 8312 S 2700 W
- 2659 W Closner Cir
- 8255 S 2700 W
- 8332 S 2700 W
- 8332 S 2700 W Unit 4
- 8276 S 2700 W
- 2656 W Closner Cir
- 2716 Spaulding Ln
- 2716 W Spaulding Ln
- 2649 Lucia Cir