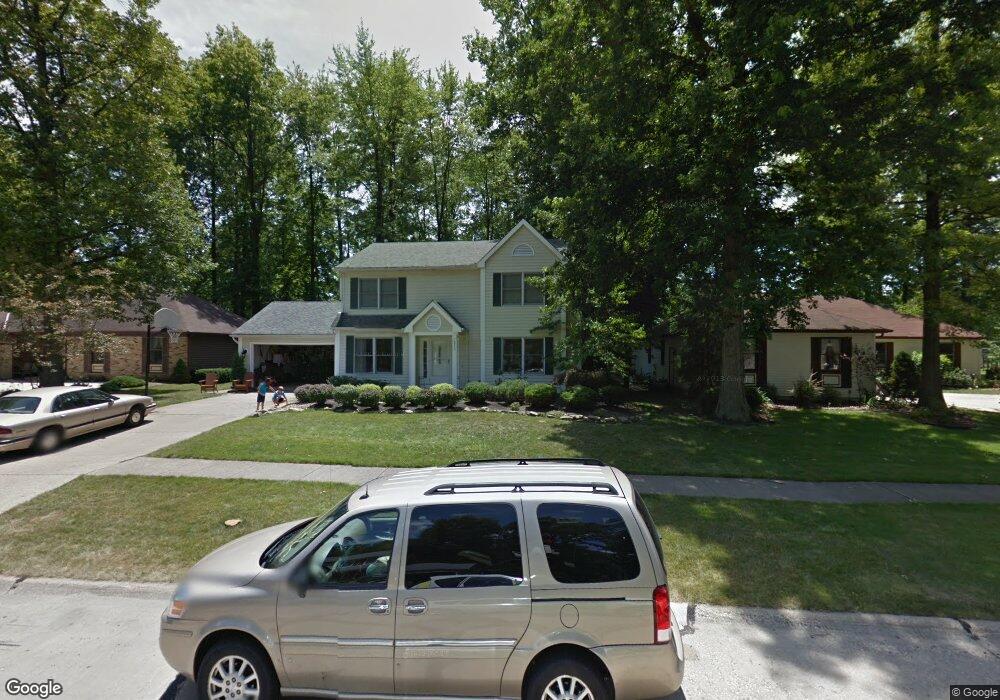
26945 Tall Oaks Trail Olmsted Falls, OH 44138
Estimated Value: $376,000 - $447,000
4
Beds
3
Baths
2,697
Sq Ft
$156/Sq Ft
Est. Value
About This Home
This home is located at 26945 Tall Oaks Trail, Olmsted Falls, OH 44138 and is currently estimated at $420,856, approximately $156 per square foot. 26945 Tall Oaks Trail is a home located in Cuyahoga County with nearby schools including Falls-Lenox Primary Elementary School, Olmsted Falls Intermediate Building, and Olmsted Falls Middle School.
Ownership History
Date
Name
Owned For
Owner Type
Purchase Details
Closed on
May 15, 2002
Sold by
Corrigan Daniel K and Corrigan Julie Patton
Bought by
Kennedy Kathleen M
Current Estimated Value
Home Financials for this Owner
Home Financials are based on the most recent Mortgage that was taken out on this home.
Original Mortgage
$213,200
Outstanding Balance
$95,942
Interest Rate
7.87%
Estimated Equity
$324,914
Purchase Details
Closed on
Mar 31, 1989
Sold by
Crozier Michael L
Bought by
Corrigan Daniel K
Purchase Details
Closed on
Nov 5, 1986
Bought by
Crozier Michael L
Purchase Details
Closed on
Jan 1, 1985
Bought by
Shorewest Const Co
Create a Home Valuation Report for This Property
The Home Valuation Report is an in-depth analysis detailing your home's value as well as a comparison with similar homes in the area
Home Values in the Area
Average Home Value in this Area
Purchase History
| Date | Buyer | Sale Price | Title Company |
|---|---|---|---|
| Kennedy Kathleen M | $207,000 | Rockport Title | |
| Corrigan Daniel K | $155,000 | -- | |
| Crozier Michael L | $143,800 | -- | |
| Shorewest Const Co | -- | -- |
Source: Public Records
Mortgage History
| Date | Status | Borrower | Loan Amount |
|---|---|---|---|
| Open | Kennedy Kathleen M | $213,200 |
Source: Public Records
Tax History Compared to Growth
Tax History
| Year | Tax Paid | Tax Assessment Tax Assessment Total Assessment is a certain percentage of the fair market value that is determined by local assessors to be the total taxable value of land and additions on the property. | Land | Improvement |
|---|---|---|---|---|
| 2024 | $10,330 | $138,425 | $22,645 | $115,780 |
| 2023 | $8,911 | $96,670 | $19,740 | $76,930 |
| 2022 | $8,851 | $96,670 | $19,740 | $76,930 |
| 2021 | $8,775 | $96,670 | $19,740 | $76,930 |
| 2020 | $8,672 | $84,810 | $17,330 | $67,480 |
| 2019 | $7,868 | $242,300 | $49,500 | $192,800 |
| 2018 | $7,043 | $79,000 | $17,330 | $61,670 |
| 2017 | $6,874 | $71,120 | $16,520 | $54,600 |
| 2016 | $6,844 | $71,120 | $16,520 | $54,600 |
| 2015 | $6,873 | $71,120 | $16,520 | $54,600 |
| 2014 | $6,873 | $69,060 | $16,030 | $53,030 |
Source: Public Records
Map
Nearby Homes
- 7224 Pine Woods Way
- 7087 Mackenzie Rd
- 6926 Mackenzie Rd
- 6706 Crestwood Ln
- 7296 Chestnut Ct
- 28130 Angela Dr
- 3 Fiddle Sticks
- 20 Van Ess Dr
- 16 Van Ess Dr
- 6556 Louann Dr
- 3 Concert Ln
- 11 Concert Ct
- 6560 Mackenzie Rd
- VANDERBURGH Plan at Olmsted - Sanctuary of
- LYNDHURST Plan at Olmsted - Sanctuary of
- BELLEVILLE Plan at Olmsted - Sanctuary of
- ALDEN Plan at Olmsted - Sanctuary of
- VALE Plan at Olmsted - Sanctuary of
- BUCHANAN Plan at Olmsted - Sanctuary of
- 7097 Stearns Rd
- 26943 Tall Oaks Trail
- 26947 Tall Oaks Trail
- 26941 Tall Oaks Trail
- 26949 Tall Oaks Trail
- 26944 Windwood Way
- 26942 Windwood Way
- 7102 Timber Ln
- 26951 Tall Oaks Trail
- 26946 Windwood Way
- 7025 Grace Dr
- 26944 Tall Oaks Trail
- 7110 Timber Ln
- 26948 Windwood Way
- 26942 Tall Oaks Trail
- 26953 Tall Oaks Trail
- 7017 Grace Dr
- 26940 Tall Oaks Trail
- 26950 Windwood Way
- 7118 Timber Ln
- 26955 Tall Oaks Trail