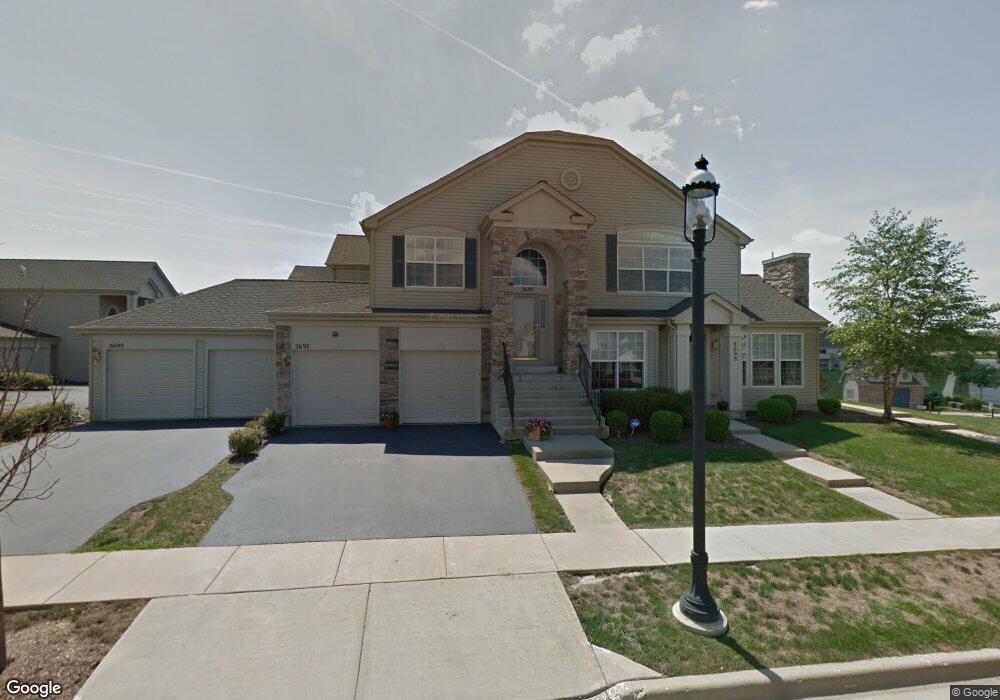
2695 Maple Cir Unit 3 West Dundee, IL 60118
Estimated Value: $261,543 - $339,000
2
Beds
--
Bath
1,356
Sq Ft
$227/Sq Ft
Est. Value
About This Home
This home is located at 2695 Maple Cir Unit 3, West Dundee, IL 60118 and is currently estimated at $307,886, approximately $227 per square foot. 2695 Maple Cir Unit 3 is a home located in Kane County with nearby schools including Dundee Highlands Elementary School, Dundee Middle School, and Harry D Jacobs High School.
Ownership History
Date
Name
Owned For
Owner Type
Purchase Details
Closed on
Oct 25, 2018
Sold by
Alexander Lu
Bought by
Bryar Ronald and Bryar Catherine
Current Estimated Value
Home Financials for this Owner
Home Financials are based on the most recent Mortgage that was taken out on this home.
Original Mortgage
$176,000
Outstanding Balance
$154,121
Interest Rate
4.6%
Mortgage Type
New Conventional
Estimated Equity
$153,765
Purchase Details
Closed on
Jul 11, 2016
Sold by
Tobin Connie M
Bought by
Tobin Connie M and Connie M Tobin Revocable Trust
Purchase Details
Closed on
Feb 22, 2005
Sold by
Grand Pointe Meadows Llc
Bought by
Tobin Connie M
Home Financials for this Owner
Home Financials are based on the most recent Mortgage that was taken out on this home.
Original Mortgage
$174,832
Interest Rate
4.87%
Mortgage Type
New Conventional
Create a Home Valuation Report for This Property
The Home Valuation Report is an in-depth analysis detailing your home's value as well as a comparison with similar homes in the area
Home Values in the Area
Average Home Value in this Area
Purchase History
| Date | Buyer | Sale Price | Title Company |
|---|---|---|---|
| Bryar Ronald | $220,000 | Heritage Title Co | |
| Tobin Connie M | -- | First American Title Ins Co | |
| Tobin Connie M | $219,000 | Ticor Title |
Source: Public Records
Mortgage History
| Date | Status | Borrower | Loan Amount |
|---|---|---|---|
| Open | Bryar Ronald | $176,000 | |
| Previous Owner | Tobin Connie M | $174,832 |
Source: Public Records
Tax History
| Year | Tax Paid | Tax Assessment Tax Assessment Total Assessment is a certain percentage of the fair market value that is determined by local assessors to be the total taxable value of land and additions on the property. | Land | Improvement |
|---|---|---|---|---|
| 2024 | $3,611 | $79,213 | $8,371 | $70,842 |
| 2023 | $3,791 | $71,273 | $7,532 | $63,741 |
| 2022 | $4,343 | $63,863 | $7,532 | $56,331 |
| 2021 | $4,455 | $60,300 | $7,112 | $53,188 |
| 2020 | $4,356 | $58,944 | $6,952 | $51,992 |
| 2019 | $4,179 | $55,956 | $6,600 | $49,356 |
| 2018 | $3,645 | $49,215 | $6,469 | $42,746 |
| 2017 | $3,697 | $48,897 | $6,051 | $42,846 |
| 2016 | $3,742 | $47,344 | $5,859 | $41,485 |
| 2015 | -- | $41,981 | $5,490 | $36,491 |
| 2014 | -- | $40,821 | $5,338 | $35,483 |
| 2013 | -- | $48,825 | $5,501 | $43,324 |
Source: Public Records
Map
Nearby Homes
- 2727 Acorn Ct Unit 4
- 2725 Acorn Ct Unit 3
- 1358 Karen Dr
- 1403 Karen Dr
- 1146 Pember Cir Unit 2
- 1107 Pember Cir Unit 2
- 36W340 Huntley Rd
- 2660 Chesire Ct
- 2737 Winton Ct
- 1601 Higgins Rd
- 817 Lindsay Ln
- 809 Lindsay Ln
- 815 Lindsay Ln
- 850 Tartans Dr
- 8007 Sierra Woods Ln Unit 8007
- 1811 W Main St
- 6850 Huntley Rd
- lot 009 Huntley Rd
- 822 Lindsay Ln
- 816 Lindsay Ln
- 2691 Acorn Ct Unit 1
- 2693 Maple Cir Unit 2
- 2697 Maple Cir Unit 4
- 2691 Maple Cir Unit 1
- 2675 Maple Cir Unit 3
- 2671 Maple Cir Unit 1
- 2673 Maple Cir Unit 2
- 2677 Maple Cir Unit 4
- 2677 Maple Cir Unit 2677
- 2628 Maple Cir Unit 4
- 2624 Maple Cir Unit 2
- 2626 Maple Cir Unit 3
- 2622 Maple Cir Unit 1
- 2685 Acorn Ct Unit 3
- 2683 Acorn Ct Unit 2
- 2683 Acorn Ct Unit B
- 2681 Acorn Ct Unit 1
- 2655 Maple Cir Unit 3
- 2653 Maple Cir Unit 2
- 2657 Maple Cir Unit 4
Your Personal Tour Guide
Ask me questions while you tour the home.