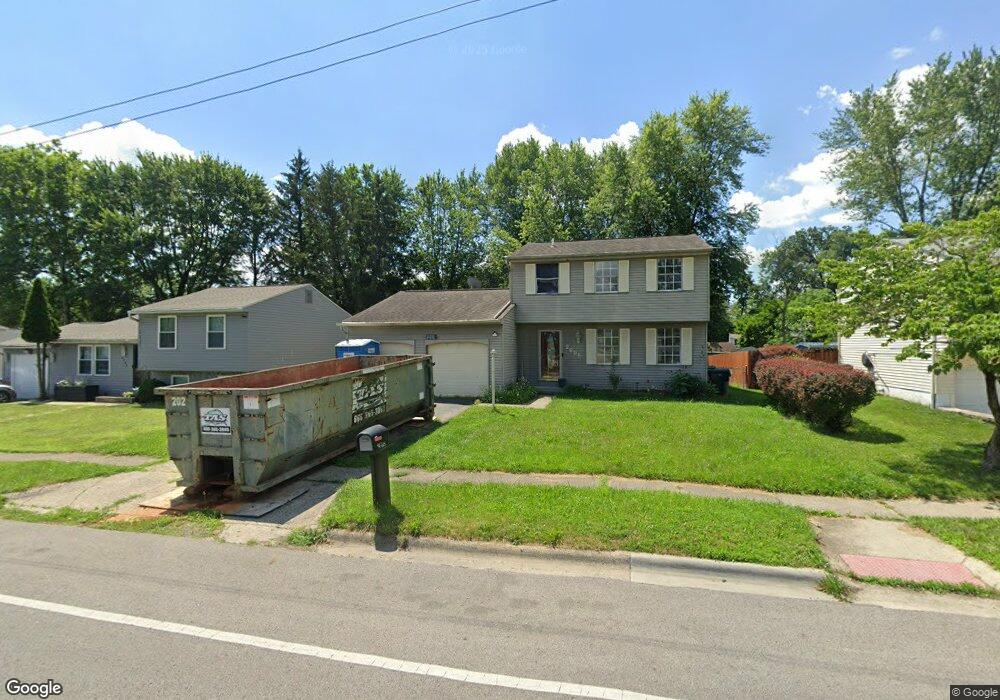
2695 Woodsedge Rd Columbus, OH 43224
Walnut Creek NeighborhoodEstimated Value: $199,000 - $307,000
3
Beds
2
Baths
1,440
Sq Ft
$178/Sq Ft
Est. Value
About This Home
This home is located at 2695 Woodsedge Rd, Columbus, OH 43224 and is currently estimated at $256,094, approximately $177 per square foot. 2695 Woodsedge Rd is a home located in Franklin County with nearby schools including Innis Elementary School, Mifflin Middle School, and Mifflin High School.
Ownership History
Date
Name
Owned For
Owner Type
Purchase Details
Closed on
Jun 23, 2010
Sold by
Brown Crystal and Brown Crystal S
Bought by
Gooch Valorie M
Current Estimated Value
Home Financials for this Owner
Home Financials are based on the most recent Mortgage that was taken out on this home.
Original Mortgage
$77,950
Interest Rate
5.37%
Mortgage Type
FHA
Purchase Details
Closed on
Aug 20, 2008
Sold by
Rychards Cliff and Rychards Patricia
Bought by
Brown Crystal and Brown Crystal S
Home Financials for this Owner
Home Financials are based on the most recent Mortgage that was taken out on this home.
Original Mortgage
$87,696
Interest Rate
6.54%
Mortgage Type
FHA
Purchase Details
Closed on
Apr 3, 2000
Sold by
Perry Perry Marsha Marsha and Perry Marsha
Bought by
Rychards Cliff and Rychards Patricia
Home Financials for this Owner
Home Financials are based on the most recent Mortgage that was taken out on this home.
Original Mortgage
$93,255
Interest Rate
8.29%
Mortgage Type
Purchase Money Mortgage
Purchase Details
Closed on
Sep 16, 1986
Bought by
Perry Marsha
Create a Home Valuation Report for This Property
The Home Valuation Report is an in-depth analysis detailing your home's value as well as a comparison with similar homes in the area
Home Values in the Area
Average Home Value in this Area
Purchase History
| Date | Buyer | Sale Price | Title Company |
|---|---|---|---|
| Gooch Valorie M | $79,000 | Attorney | |
| Brown Crystal | $90,000 | Talon Group | |
| Rychards Cliff | $92,500 | -- | |
| Perry Marsha | $57,000 | -- |
Source: Public Records
Mortgage History
| Date | Status | Borrower | Loan Amount |
|---|---|---|---|
| Previous Owner | Gooch Valorie M | $77,950 | |
| Previous Owner | Brown Crystal | $87,696 | |
| Previous Owner | Rychards Cliff | $93,255 |
Source: Public Records
Tax History Compared to Growth
Tax History
| Year | Tax Paid | Tax Assessment Tax Assessment Total Assessment is a certain percentage of the fair market value that is determined by local assessors to be the total taxable value of land and additions on the property. | Land | Improvement |
|---|---|---|---|---|
| 2024 | $3,205 | $71,410 | $15,230 | $56,180 |
| 2023 | $3,164 | $71,400 | $15,225 | $56,175 |
| 2022 | $2,340 | $45,120 | $6,580 | $38,540 |
| 2021 | $2,344 | $45,120 | $6,580 | $38,540 |
| 2020 | $2,347 | $45,120 | $6,580 | $38,540 |
| 2019 | $2,164 | $35,670 | $5,250 | $30,420 |
| 2018 | $1,900 | $35,670 | $5,250 | $30,420 |
| 2017 | $2,163 | $35,670 | $5,250 | $30,420 |
| 2016 | $1,806 | $27,270 | $5,080 | $22,190 |
| 2015 | $1,640 | $27,270 | $5,080 | $22,190 |
| 2014 | $1,644 | $27,270 | $5,080 | $22,190 |
| 2013 | $954 | $32,095 | $5,985 | $26,110 |
Source: Public Records
Map
Nearby Homes
- 2551-2553 Woodsedge Rd
- 2853 Stonecreek Ct Unit 2853
- 2450 Winding Hills Ct Unit 2450
- 2621 Ipswick Cir
- 2781 Innis Rd Unit C
- 2781 Innis Rd Unit F
- 3609 Westerville Rd Unit P-49
- 2503 Hingham Ln
- 4165 Sunbury Rd
- 2547 Ferris Park Dr S
- 2529 Ferris Park Dr S
- 3335 Sycamore Knoll Dr
- 2640 Milverton Way
- 2927 Poolside Dr Unit 10
- 4161 Grayfriars Ln
- 2220 Sale Rd
- 3685 Cleveland Ave
- 4090 Cleveland Ave
- 2283 Ward Rd
- 3137 Westerville Rd Unit 44
- 2703 Woodsedge Rd
- 2687 Woodsedge Rd
- 2686 Southridge Dr
- 2679 Woodsedge Rd
- 3493 Sweetday St
- 2680 Southridge Dr
- 2704 Southridge Dr
- 2686 Woodsedge Rd
- 2710 Woodsedge Rd
- 2671 Woodsedge Rd
- 3475 Sweetday St
- 2672 Southridge Dr
- 3525 Red Clover Place
- 3524 Red Clover Place
- 3494 Sweetday St
- 3515 Walnut Creek Dr
- 2695 Southridge Dr
- 2685 Southridge Dr
- 3532 Red Clover Place
- 3533 Red Clover Place