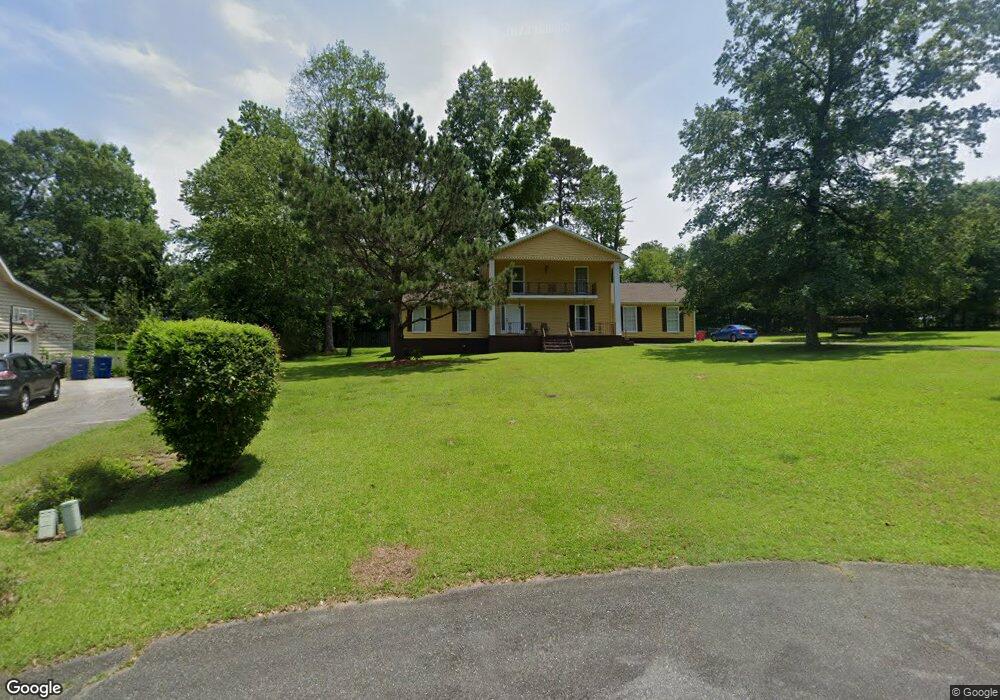
2696 Carriage Ct Macon, GA 31216
Estimated Value: $279,623 - $317,000
4
Beds
3
Baths
2,304
Sq Ft
$132/Sq Ft
Est. Value
About This Home
This home is located at 2696 Carriage Ct, Macon, GA 31216 and is currently estimated at $304,156, approximately $132 per square foot. 2696 Carriage Ct is a home located in Bibb County with nearby schools including Heritage Elementary School, Weaver Middle School, and Westside High School.
Ownership History
Date
Name
Owned For
Owner Type
Purchase Details
Closed on
Jun 13, 2020
Sold by
Ware Cynthia L and Murray Cynthia L
Bought by
Murray Cynthia L
Current Estimated Value
Home Financials for this Owner
Home Financials are based on the most recent Mortgage that was taken out on this home.
Original Mortgage
$111,000
Outstanding Balance
$77,463
Interest Rate
3.2%
Mortgage Type
New Conventional
Estimated Equity
$226,693
Purchase Details
Closed on
Oct 28, 2010
Sold by
Coleman Properties Inc
Bought by
Ware Cynthia L
Home Financials for this Owner
Home Financials are based on the most recent Mortgage that was taken out on this home.
Original Mortgage
$113,372
Interest Rate
4.5%
Mortgage Type
FHA
Purchase Details
Closed on
Mar 22, 2010
Sold by
Wells Fargo Bank Na
Bought by
Coleman Properties Inc
Purchase Details
Closed on
May 6, 2008
Sold by
Pepin Mark A and Pepin Cheryl M
Bought by
Wells Fargo Bank Na
Create a Home Valuation Report for This Property
The Home Valuation Report is an in-depth analysis detailing your home's value as well as a comparison with similar homes in the area
Home Values in the Area
Average Home Value in this Area
Purchase History
| Date | Buyer | Sale Price | Title Company |
|---|---|---|---|
| Murray Cynthia L | -- | Title365 | |
| Ware Cynthia L | $114,900 | None Available | |
| Coleman Properties Inc | $51,000 | None Available | |
| Wells Fargo Bank Na | $155,000 | None Available |
Source: Public Records
Mortgage History
| Date | Status | Borrower | Loan Amount |
|---|---|---|---|
| Open | Murray Cynthia L | $111,000 | |
| Closed | Ware Cynthia L | $113,372 |
Source: Public Records
Tax History Compared to Growth
Tax History
| Year | Tax Paid | Tax Assessment Tax Assessment Total Assessment is a certain percentage of the fair market value that is determined by local assessors to be the total taxable value of land and additions on the property. | Land | Improvement |
|---|---|---|---|---|
| 2025 | $2,304 | $93,770 | $16,600 | $77,170 |
| 2024 | $2,381 | $93,770 | $16,600 | $77,170 |
| 2023 | $2,055 | $80,909 | $16,600 | $64,309 |
| 2022 | $2,591 | $74,846 | $12,432 | $62,414 |
| 2021 | $2,564 | $67,483 | $14,277 | $53,206 |
| 2020 | $2,103 | $54,178 | $12,849 | $41,329 |
| 2019 | $2,121 | $54,178 | $12,849 | $41,329 |
| 2018 | $3,428 | $54,178 | $12,849 | $41,329 |
| 2017 | $1,905 | $50,853 | $12,849 | $38,004 |
| 2016 | $1,759 | $50,853 | $12,849 | $38,004 |
| 2015 | $2,991 | $61,076 | $14,277 | $46,799 |
| 2014 | $2,996 | $61,076 | $14,277 | $46,799 |
Source: Public Records
Map
Nearby Homes
- 2667 Carriage Ct
- 2684 Fringe Cir
- 2616 Minuette Ct
- 6375 Stapleton Rd
- 2671 Fringe Cir
- 132 Pineworth Pointe Dr
- 126 Pineworth Pointe Dr
- 2617 Penbrook Ln
- 312 Pinnacle Park
- Plan 3629 at Treetops
- Plan 2100 at Treetops
- Plan 2307 at Treetops
- Plan 2628 at Treetops
- Plan 2316 at Treetops
- Plan 2700 at Treetops
- Plan 2620 at Treetops
- 155 Kinsale Dr
- 209 Shoreline Way
- 213 Shoreline Way Unit LOT A018
- 221 Shoreline Way
- 2687 Minuette Ct
- 2663 Minuette Ct
- 2666 Carriage Ct
- 2697 Carriage Ct
- 6335 Stapleton Rd
- 6345 Stapleton Rd
- 6305 Stapleton Rd
- 2647 Minuette Ct
- 6365 Stapleton Rd
- 2637 Carriage Ct
- 2696 Fringe Cir
- 0 Stapleton Rd Unit 8972440
- 0 Stapleton Rd Unit 8185303
- 0 Stapleton Rd Unit 3225887
- 0 Stapleton Rd Unit 8045360
- 2676 Minuette Ct
- 2627 Minuette Ct
- 2658 Minuette Ct
- 6271 Stapleton Rd
- 2638 Minuette Ct