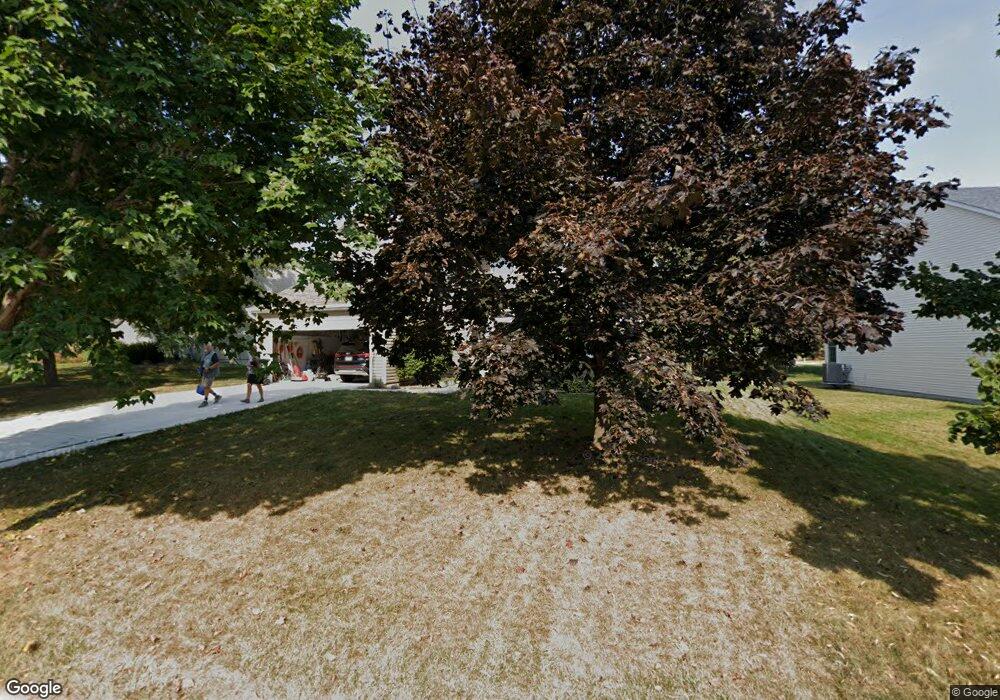
2696 Delaware Ln Lindenhurst, IL 60046
Estimated Value: $436,765 - $461,000
3
Beds
3
Baths
2,508
Sq Ft
$179/Sq Ft
Est. Value
About This Home
This home is located at 2696 Delaware Ln, Lindenhurst, IL 60046 and is currently estimated at $448,941, approximately $179 per square foot. 2696 Delaware Ln is a home located in Lake County with nearby schools including Millburn Elementary School, Millburn Middle School, and Lakes Community High School.
Ownership History
Date
Name
Owned For
Owner Type
Purchase Details
Closed on
Sep 25, 2001
Sold by
Iskalis Annalisa
Bought by
Laudenslager Edward D and Laudenslager Joyce E
Current Estimated Value
Home Financials for this Owner
Home Financials are based on the most recent Mortgage that was taken out on this home.
Original Mortgage
$180,000
Interest Rate
6.99%
Mortgage Type
Balloon
Purchase Details
Closed on
Dec 17, 1999
Sold by
Hazdra Gregory S
Bought by
Iskalis Thomas and Iskalis Annalisa
Home Financials for this Owner
Home Financials are based on the most recent Mortgage that was taken out on this home.
Original Mortgage
$209,000
Interest Rate
7.69%
Purchase Details
Closed on
Aug 28, 1997
Sold by
The Ryland Group Inc
Bought by
Hazdra Gregory S
Home Financials for this Owner
Home Financials are based on the most recent Mortgage that was taken out on this home.
Original Mortgage
$98,500
Interest Rate
7.44%
Create a Home Valuation Report for This Property
The Home Valuation Report is an in-depth analysis detailing your home's value as well as a comparison with similar homes in the area
Home Values in the Area
Average Home Value in this Area
Purchase History
| Date | Buyer | Sale Price | Title Company |
|---|---|---|---|
| Laudenslager Edward D | $262,000 | -- | |
| Iskalis Thomas | $220,000 | -- | |
| Hazdra Gregory S | $137,666 | -- |
Source: Public Records
Mortgage History
| Date | Status | Borrower | Loan Amount |
|---|---|---|---|
| Closed | Laudenslager Edward D | $180,000 | |
| Previous Owner | Iskalis Thomas | $209,000 | |
| Previous Owner | Hazdra Gregory S | $98,500 |
Source: Public Records
Tax History Compared to Growth
Tax History
| Year | Tax Paid | Tax Assessment Tax Assessment Total Assessment is a certain percentage of the fair market value that is determined by local assessors to be the total taxable value of land and additions on the property. | Land | Improvement |
|---|---|---|---|---|
| 2024 | $9,988 | $118,618 | $18,567 | $100,051 |
| 2023 | $11,386 | $104,805 | $16,405 | $88,400 |
| 2022 | $11,386 | $95,322 | $12,071 | $83,251 |
| 2021 | $10,916 | $88,548 | $11,213 | $77,335 |
| 2020 | $10,504 | $85,711 | $10,854 | $74,857 |
| 2019 | $11,280 | $87,601 | $11,093 | $76,508 |
| 2018 | $9,736 | $84,360 | $14,422 | $69,938 |
| 2017 | $9,770 | $82,110 | $14,037 | $68,073 |
| 2016 | $11,650 | $87,540 | $14,965 | $72,575 |
| 2015 | $11,117 | $81,760 | $13,977 | $67,783 |
| 2014 | $10,444 | $74,222 | $14,042 | $60,180 |
| 2012 | $9,897 | $87,878 | $16,729 | $71,149 |
Source: Public Records
Map
Nearby Homes
- 2726 Providence Ln
- 590 Oxford Ln
- 586 Harvard Ct
- 692 Monroe Dr
- 694 Monroe Dr
- 19135 W Millburn Rd
- 527 Northgate Rd Unit 28
- 691 N Autumn Cir
- 422 Northgate Rd
- 1896 E Vista Terrace
- 1847 Natures Ct
- 4103 Neubauer Cir Unit 402
- 1820 Prairie Ridge Cir
- 812 Auburn Ln
- 3707 Neubauer Cir
- 1507 Neubauer Cir
- 1707 Neubauer Cir
- 1200 Neubauer Cir Unit 1306
- Chatham Plan at Heritage Park
- Chelsea Plan at Heritage Park
- 2684 Delaware Ln
- 2710 Delaware Ln
- 2685 Providence Ln
- 2672 Delaware Ln
- 2673 Providence Ln
- 2689 Delaware Ln
- 2699 Delaware Ln
- 2715 Delaware Ln
- 2661 Providence Ln
- 2707 Delaware Ln
- 2677 Delaware Ln
- 2660 Delaware Ln
- 2669 Delaware Ln
- 2730 Delaware Ln
- 2651 Providence Ln
- 2707 Providence Ln
- 2648 Delaware Ln
- 2737 Delaware Ln
- 2657 Delaware Ln
- 2670 Providence Ln