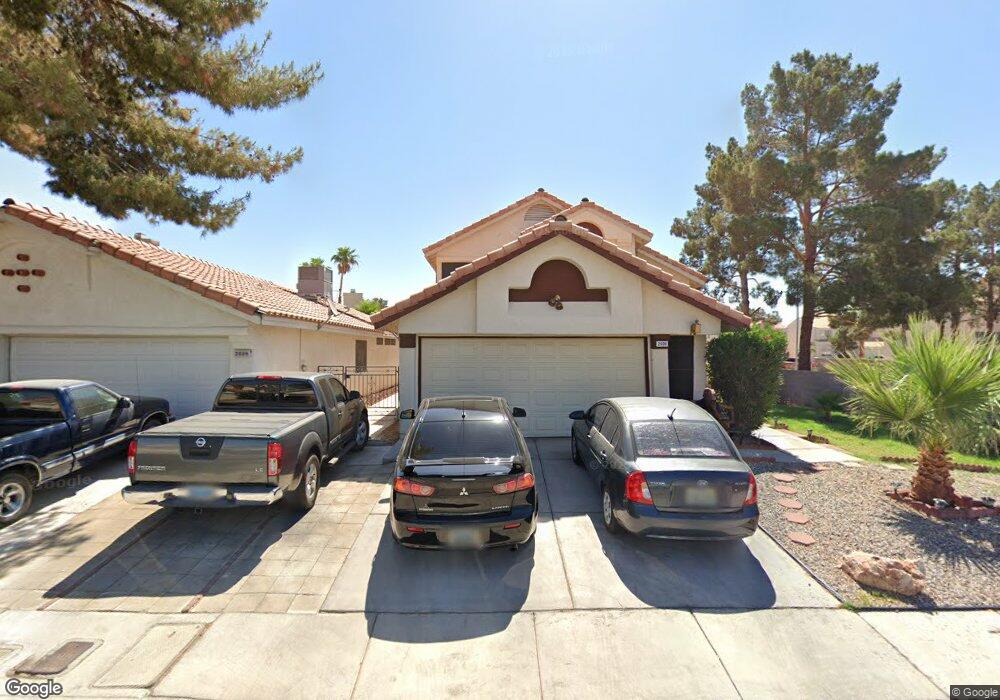
2696 Rungsted St Las Vegas, NV 89142
Estimated Value: $376,000 - $389,000
3
Beds
3
Baths
1,678
Sq Ft
$228/Sq Ft
Est. Value
About This Home
This home is located at 2696 Rungsted St, Las Vegas, NV 89142 and is currently estimated at $382,840, approximately $228 per square foot. 2696 Rungsted St is a home located in Clark County with nearby schools including Jenkins Earl N. Elementary School, Kathleen & Tim Harney Middle School, and Chaparral High School.
Ownership History
Date
Name
Owned For
Owner Type
Purchase Details
Closed on
May 2, 2019
Sold by
Williams Yalandra M and Williams Cornell V
Bought by
Williams Yalandra M and Williams Cornell V
Current Estimated Value
Purchase Details
Closed on
May 16, 2000
Sold by
Associates Relocation Management Co Inc
Bought by
Williams Cornell and Williams Yalandra M
Home Financials for this Owner
Home Financials are based on the most recent Mortgage that was taken out on this home.
Original Mortgage
$123,773
Outstanding Balance
$42,883
Interest Rate
8.18%
Mortgage Type
FHA
Estimated Equity
$339,957
Purchase Details
Closed on
Mar 19, 2000
Sold by
Bradley Julian M and Bradley Joellen B
Bought by
Associates Relocation Management Co Inc
Home Financials for this Owner
Home Financials are based on the most recent Mortgage that was taken out on this home.
Original Mortgage
$123,773
Outstanding Balance
$42,883
Interest Rate
8.18%
Mortgage Type
FHA
Estimated Equity
$339,957
Create a Home Valuation Report for This Property
The Home Valuation Report is an in-depth analysis detailing your home's value as well as a comparison with similar homes in the area
Home Values in the Area
Average Home Value in this Area
Purchase History
| Date | Buyer | Sale Price | Title Company |
|---|---|---|---|
| Williams Yalandra M | -- | None Available | |
| Williams Cornell | $124,000 | United Title | |
| Associates Relocation Management Co Inc | $124,000 | United Title |
Source: Public Records
Mortgage History
| Date | Status | Borrower | Loan Amount |
|---|---|---|---|
| Open | Williams Cornell | $123,773 |
Source: Public Records
Tax History Compared to Growth
Tax History
| Year | Tax Paid | Tax Assessment Tax Assessment Total Assessment is a certain percentage of the fair market value that is determined by local assessors to be the total taxable value of land and additions on the property. | Land | Improvement |
|---|---|---|---|---|
| 2025 | $1,091 | $65,360 | $22,750 | $42,610 |
| 2024 | $1,060 | $65,360 | $22,750 | $42,610 |
| 2023 | $811 | $66,324 | $25,200 | $41,124 |
| 2022 | $1,128 | $59,412 | $21,700 | $37,712 |
| 2021 | $1,045 | $55,115 | $18,900 | $36,215 |
| 2020 | $967 | $55,237 | $18,900 | $36,337 |
| 2019 | $906 | $52,505 | $16,450 | $36,055 |
| 2018 | $865 | $47,280 | $12,600 | $34,680 |
| 2017 | $1,405 | $47,895 | $12,600 | $35,295 |
| 2016 | $811 | $40,373 | $8,050 | $32,323 |
| 2015 | $808 | $34,817 | $7,700 | $27,117 |
| 2014 | $785 | $25,951 | $5,250 | $20,701 |
Source: Public Records
Map
Nearby Homes
- 2745 Poppyseed Way
- 2819 Beaconfalls Way
- 2966 Juniper Hills Blvd Unit 201
- 2966 Juniper Hills Blvd Unit 204
- 2966 Juniper Hills Blvd Unit 102
- 5330 Walton Heath Ave
- 2711 Sesame Dr
- 2986 Juniper Hills Blvd Unit 202
- 5402 Tahoe Dr
- 2983 Juniper Hills Blvd Unit 201
- 2983 Juniper Hills Blvd Unit 102
- 2969 Juniper Hills Blvd Unit 103
- 2883 Mammoth Ct
- 3001 Cabana Dr Unit 107
- 5495 Everglade St
- 5466 Petaca Rd
- 5615 Everglade St
- 2450 Tournament St
- 5512 Aldama Rd
- 2484 Anglia St
- 2688 Rungsted St
- 2680 Rungsted St
- 2680 Rungsted St Unit n/a
- 2697 Prairie Dunes Dr
- 2726 Rungsted St
- 2689 Prairie Dunes Dr
- 2672 Rungsted St
- 2727 Quaker Ridge Rd
- 2681 Prairie Dunes Dr
- 2689 Rungsted St
- 2736 Rungsted St
- 2664 Rungsted St
- 2673 Prairie Dunes Dr
- 2673 Prairie Dunes Dr Unit na
- 2737 Quaker Ridge Rd
- 2681 Rungsted St
- 2725 Rungsted St
- 2665 Prairie Dunes Dr Unit 3
- 2728 Quaker Ridge Rd
- 2656 Rungsted St Unit 3