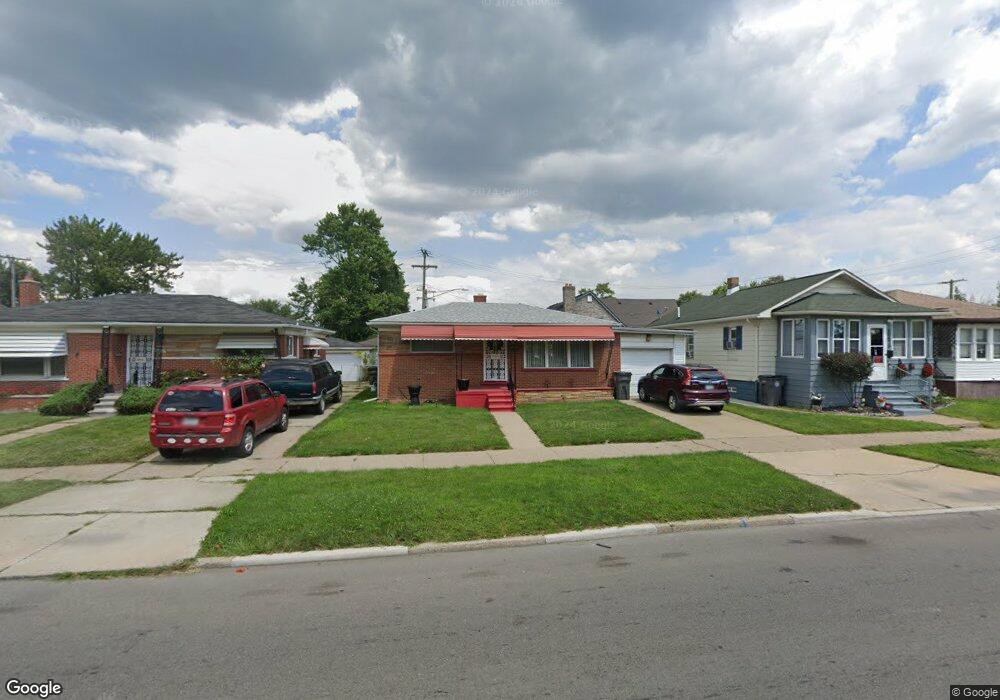
26969 W Outer Dr Ecorse, MI 48229
Estimated Value: $92,000 - $126,766
3
Beds
1
Bath
1,168
Sq Ft
$98/Sq Ft
Est. Value
About This Home
This home is located at 26969 W Outer Dr, Ecorse, MI 48229 and is currently estimated at $114,192, approximately $97 per square foot. 26969 W Outer Dr is a home located in Wayne County with nearby schools including Ralph J. Bunche Elementary, Grandport Academy, and Ecorse High School.
Ownership History
Date
Name
Owned For
Owner Type
Purchase Details
Closed on
Oct 21, 2025
Sold by
Baker-Levingston Rhonda K and Greer Robert E
Bought by
Levingston Philip M and Levingston Roderick D
Current Estimated Value
Purchase Details
Closed on
Mar 31, 2009
Sold by
Secretary Of Housing & Urban Development
Bought by
Baker Levingston Rhonda K
Purchase Details
Closed on
Jun 4, 2008
Sold by
Washington Mutual Bank Fa
Bought by
Hud
Purchase Details
Closed on
Aug 4, 2006
Sold by
Mortgage Electronic Registration Systems
Bought by
Washington Mutual Bank Fa
Purchase Details
Closed on
Jan 18, 2006
Sold by
Redwine Cheryl Bonita and Clayton Alex D
Bought by
Mortgage Electronic Registration Systems and Great American Mortgage Corp
Create a Home Valuation Report for This Property
The Home Valuation Report is an in-depth analysis detailing your home's value as well as a comparison with similar homes in the area
Home Values in the Area
Average Home Value in this Area
Purchase History
| Date | Buyer | Sale Price | Title Company |
|---|---|---|---|
| Levingston Philip M | -- | None Listed On Document | |
| Baker Levingston Rhonda K | $11,000 | None Available | |
| Hud | -- | None Available | |
| Washington Mutual Bank Fa | -- | None Available | |
| Mortgage Electronic Registration Systems | $80,795 | None Available |
Source: Public Records
Tax History
| Year | Tax Paid | Tax Assessment Tax Assessment Total Assessment is a certain percentage of the fair market value that is determined by local assessors to be the total taxable value of land and additions on the property. | Land | Improvement |
|---|---|---|---|---|
| 2025 | $1,071 | $54,300 | $0 | $0 |
| 2024 | $1,096 | $44,000 | $0 | $0 |
| 2023 | $1,126 | $41,100 | $0 | $0 |
| 2022 | $2,174 | $33,100 | $0 | $0 |
| 2021 | $2,210 | $26,000 | $0 | $0 |
| 2019 | $2,138 | $19,200 | $0 | $0 |
| 2018 | $1,008 | $16,000 | $0 | $0 |
| 2017 | $2,151 | $16,200 | $0 | $0 |
| 2016 | $2,547 | $17,800 | $0 | $0 |
| 2013 | $3,330 | $34,100 | $0 | $0 |
| 2012 | $2,075 | $36,200 | $4,100 | $32,100 |
Source: Public Records
Map
Nearby Homes
Your Personal Tour Guide
Ask me questions while you tour the home.