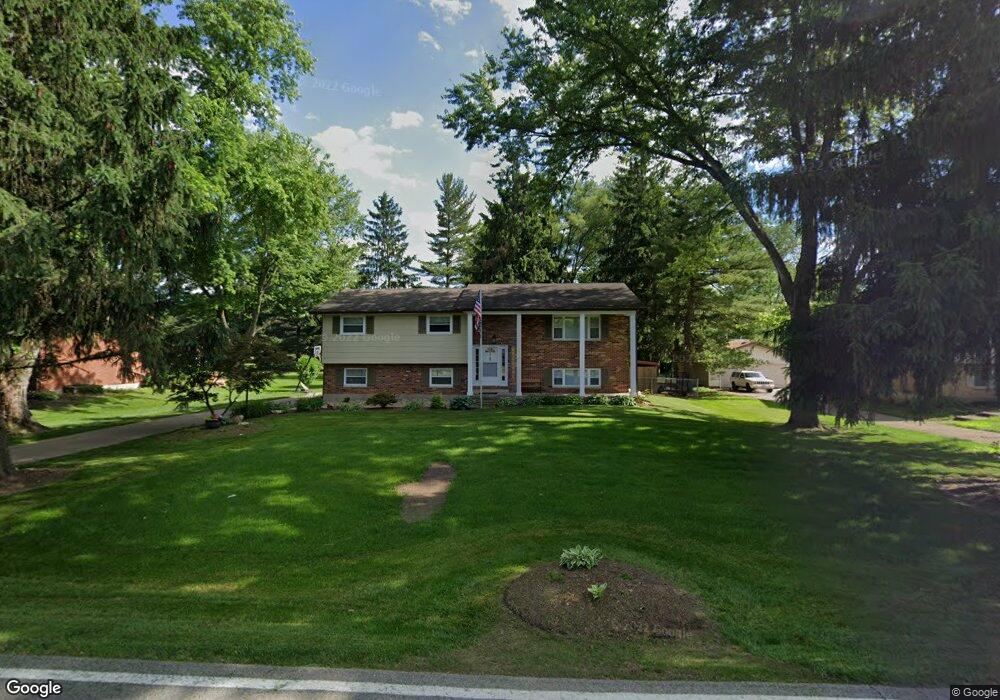
2697 Lantz Rd Beavercreek, OH 45434
Estimated Value: $255,000 - $344,000
3
Beds
2
Baths
1,398
Sq Ft
$208/Sq Ft
Est. Value
About This Home
This home is located at 2697 Lantz Rd, Beavercreek, OH 45434 and is currently estimated at $291,480, approximately $208 per square foot. 2697 Lantz Rd is a home located in Greene County with nearby schools including Main Elementary School, Jacob Coy Middle School, and Beavercreek High School.
Ownership History
Date
Name
Owned For
Owner Type
Purchase Details
Closed on
Nov 6, 2014
Sold by
Kondaur Capital Corp
Bought by
Burke Michael L
Current Estimated Value
Home Financials for this Owner
Home Financials are based on the most recent Mortgage that was taken out on this home.
Original Mortgage
$116,910
Outstanding Balance
$89,886
Interest Rate
4.1%
Mortgage Type
New Conventional
Estimated Equity
$201,594
Purchase Details
Closed on
Jul 2, 2014
Sold by
Osborn Michael A and Wagner John A
Bought by
Kondaur Capital Corp
Purchase Details
Closed on
Jul 2, 2002
Sold by
Wagner John A and Wagner Julia M
Bought by
Osborn Michael A
Home Financials for this Owner
Home Financials are based on the most recent Mortgage that was taken out on this home.
Original Mortgage
$123,028
Interest Rate
6.79%
Mortgage Type
FHA
Create a Home Valuation Report for This Property
The Home Valuation Report is an in-depth analysis detailing your home's value as well as a comparison with similar homes in the area
Home Values in the Area
Average Home Value in this Area
Purchase History
| Date | Buyer | Sale Price | Title Company |
|---|---|---|---|
| Burke Michael L | $129,900 | Chicago Title Insurance Co | |
| Kondaur Capital Corp | $100,000 | None Available | |
| Osborn Michael A | $124,000 | -- |
Source: Public Records
Mortgage History
| Date | Status | Borrower | Loan Amount |
|---|---|---|---|
| Open | Burke Michael L | $116,910 | |
| Previous Owner | Osborn Michael A | $123,028 |
Source: Public Records
Tax History Compared to Growth
Tax History
| Year | Tax Paid | Tax Assessment Tax Assessment Total Assessment is a certain percentage of the fair market value that is determined by local assessors to be the total taxable value of land and additions on the property. | Land | Improvement |
|---|---|---|---|---|
| 2024 | $5,258 | $78,970 | $17,890 | $61,080 |
| 2023 | $5,258 | $78,970 | $17,890 | $61,080 |
| 2022 | $4,564 | $60,500 | $12,780 | $47,720 |
| 2021 | $4,474 | $60,500 | $12,780 | $47,720 |
| 2020 | $4,507 | $60,500 | $12,780 | $47,720 |
| 2019 | $3,882 | $47,570 | $10,720 | $36,850 |
| 2018 | $3,436 | $47,570 | $10,720 | $36,850 |
| 2017 | $3,379 | $47,570 | $10,720 | $36,850 |
| 2016 | $3,547 | $47,560 | $10,720 | $36,840 |
| 2015 | $3,526 | $47,560 | $10,720 | $36,840 |
| 2014 | $1,815 | $47,560 | $10,720 | $36,840 |
Source: Public Records
Map
Nearby Homes
- 1482 Fudge Dr
- 1359 Fudge Dr
- 2853 Oriole Dr
- 2507 Obetz Dr
- 2691 Majestic Oaks Ct
- 1520 Hillside Dr
- 5 Hickory Dr
- 2082 Tamarack Ridge Ct
- 2331 Eastwind Dr
- 2938 Bruce Ct
- 1394 Crown Point Ct
- 1361 Obetz Dr Unit A
- 1210 Lomeda Ln
- 2725 Terraceview Cir
- 3196 Suburban Dr
- 3178 Lantz Rd
- 2162 Sulky Trail
- 1155 Forest Dr
- 2154 Sulky Trail
- 2245 Tourney Trail
- 2687 Lantz Rd
- 2707 Lantz Rd
- 2677 Lantz Rd
- 2717 Lantz Rd
- 2696 Coldsprings Dr
- 2686 Coldsprings Dr
- 2704 Lantz Rd
- 2694 Lantz Rd
- 2727 Lantz Rd
- 2667 Lantz Rd
- 2714 Lantz Rd
- 2676 Coldsprings Dr
- 2716 Coldsprings Dr
- 2682 Lantz Rd
- 2726 Coldsprings Dr
- 2666 Coldsprings Dr
- 2737 Lantz Rd
- 2672 Lantz Rd
- 2742 Lantz Rd
- 1655 Shoreham Dr