26984 Carrington Place Unit 4 45 Harrison Township, MI 48045
Estimated Value: $212,749 - $229,000
2
Beds
2
Baths
1,387
Sq Ft
$159/Sq Ft
Est. Value
About This Home
This home is located at 26984 Carrington Place Unit 4 45, Harrison Township, MI 48045 and is currently estimated at $220,937, approximately $159 per square foot. 26984 Carrington Place Unit 4 45 is a home located in Macomb County with nearby schools including Marie C. Graham Elementary School and L'Anse Creuse High School.
Ownership History
Date
Name
Owned For
Owner Type
Purchase Details
Closed on
May 23, 2017
Sold by
Braun Patricia V
Bought by
Braun Patricia V and Braun Douglas
Current Estimated Value
Purchase Details
Closed on
Nov 14, 2016
Sold by
Hunt Eric K
Bought by
Braun Patricia V
Home Financials for this Owner
Home Financials are based on the most recent Mortgage that was taken out on this home.
Original Mortgage
$50,000
Outstanding Balance
$32,032
Interest Rate
3.42%
Mortgage Type
New Conventional
Estimated Equity
$188,905
Purchase Details
Closed on
Oct 23, 2013
Sold by
Hunt Elsie and Hunt Elvington
Bought by
Hunt Eric K
Home Financials for this Owner
Home Financials are based on the most recent Mortgage that was taken out on this home.
Original Mortgage
$135,372
Interest Rate
4.25%
Mortgage Type
FHA
Purchase Details
Closed on
Nov 4, 2008
Sold by
Mjc Harrison Village Llc
Bought by
Hunt Eric K and Hunt Elvington
Create a Home Valuation Report for This Property
The Home Valuation Report is an in-depth analysis detailing your home's value as well as a comparison with similar homes in the area
Home Values in the Area
Average Home Value in this Area
Purchase History
| Date | Buyer | Sale Price | Title Company |
|---|---|---|---|
| Braun Patricia V | -- | None Available | |
| Braun Patricia V | $133,000 | None Available | |
| Hunt Eric K | -- | Continental Title Agency Llc | |
| Hunt Eric K | $145,000 | Greco |
Source: Public Records
Mortgage History
| Date | Status | Borrower | Loan Amount |
|---|---|---|---|
| Open | Braun Patricia V | $50,000 | |
| Previous Owner | Hunt Eric K | $135,372 |
Source: Public Records
Tax History Compared to Growth
Tax History
| Year | Tax Paid | Tax Assessment Tax Assessment Total Assessment is a certain percentage of the fair market value that is determined by local assessors to be the total taxable value of land and additions on the property. | Land | Improvement |
|---|---|---|---|---|
| 2025 | $2,522 | $87,300 | $0 | $0 |
| 2024 | $1,717 | $84,600 | $0 | $0 |
| 2023 | $1,628 | $77,900 | $0 | $0 |
| 2022 | $2,282 | $73,000 | $0 | $0 |
| 2021 | $2,193 | $72,800 | $0 | $0 |
| 2020 | $1,495 | $65,500 | $0 | $0 |
| 2019 | $2,023 | $62,200 | $0 | $0 |
| 2018 | $2,077 | $64,000 | $0 | $0 |
| 2017 | $1,990 | $58,520 | $10,000 | $48,520 |
| 2016 | $1,690 | $58,520 | $0 | $0 |
| 2015 | -- | $52,990 | $0 | $0 |
| 2012 | $1,801 | $55,720 | $0 | $0 |
Source: Public Records
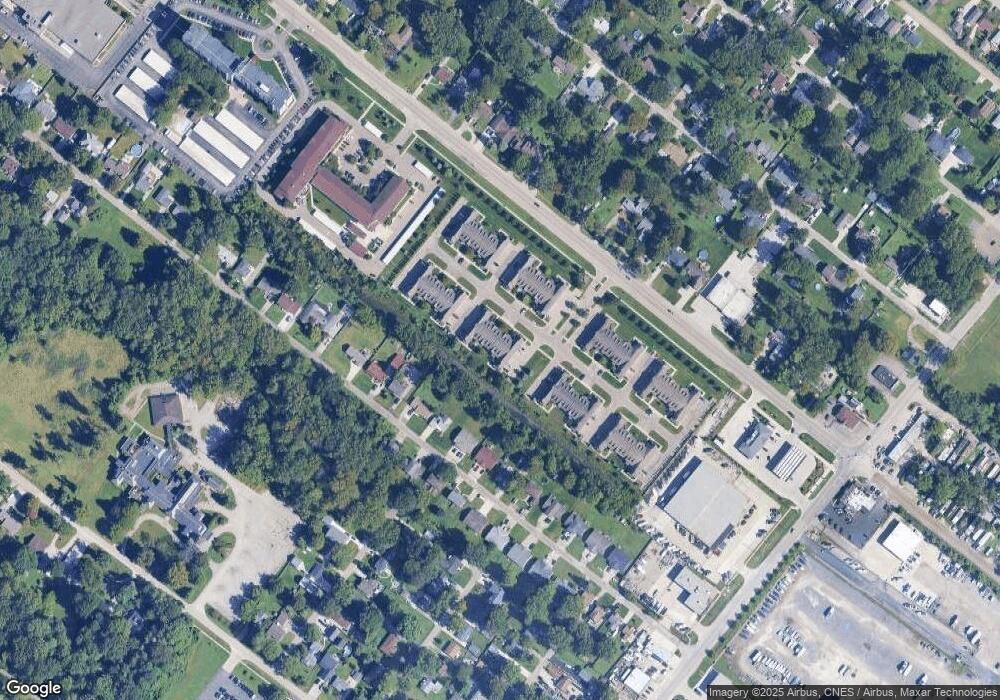
Map
Nearby Homes
- 36141 Homeview St
- 26485 Crocker Blvd
- 26655 Hickler Ln
- 0 Winkler St Unit 50184800
- 25983 Maritime Cir S
- 25820 Maritime Cir N Unit 52
- 25891 Ballard St
- 25887 Gatz St Unit 5
- 27927 Ponchartrain St
- 37281 Clio St
- 0 Vandy St Unit 50075656
- 37240 Jefferson Ave
- 25052 Portside Ct Unit 55
- 37252 Jefferson Ave
- 01 Vandy St
- 24708 Spring Ln Unit 37
- 35610 Jeffers Ct
- 24645 Spring Ln Unit 18
- 25154 S Magdalena St
- 24621 Spring Ln Unit 6
- 26992 Carrington Place Unit 4 43
- 26948 Carrington Place Unit 4 37
- 26968 Carrington Place Unit 48
- 26964 Carrington Place Unit 47
- 26960 Carrington Place Unit 46
- 26984 Carrington Place Unit 45
- 26988 Carrington Place Unit 44
- 26992 Carrington Place Unit 43
- 26972 Carrington Place Unit 42
- 26976 Carrington Place Unit 41
- 26980 Carrington Place Unit 40
- 26956 Carrington Place Unit 39
- 26948 Carrington Place Unit 37
- 26988 Carrington Place Unit 4 44
- 26972 Carrington Place Unit 4, 42
- 26960 Carrington Plc
- 26988 Carrington Plc
- 26696 Carrington Place
- 27021 Carrington Place Unit 96
- 27021 Carrington Place Unit 8, 96