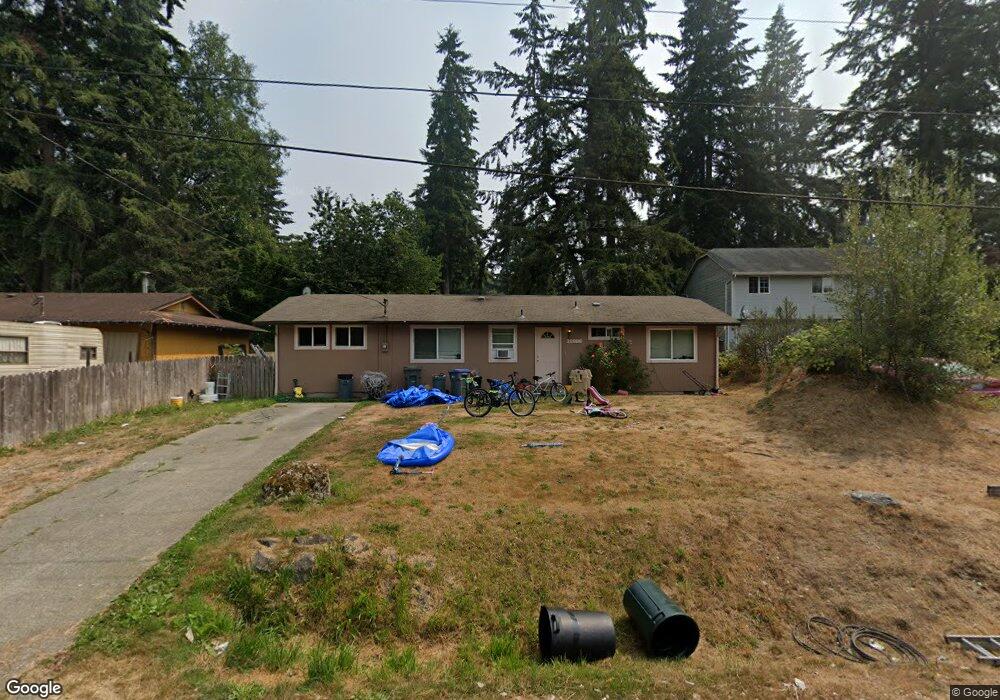
26986 Wagner Cir NE Kingston, WA 98346
Estimated Value: $427,403 - $486,000
3
Beds
1
Bath
1,296
Sq Ft
$346/Sq Ft
Est. Value
About This Home
This home is located at 26986 Wagner Cir NE, Kingston, WA 98346 and is currently estimated at $448,601, approximately $346 per square foot. 26986 Wagner Cir NE is a home located in Kitsap County with nearby schools including David Wolfle Elementary School, Kingston Middle School, and Kingston High School.
Ownership History
Date
Name
Owned For
Owner Type
Purchase Details
Closed on
May 16, 2012
Sold by
Ramirez Karina
Bought by
Ramirez Efrain
Current Estimated Value
Home Financials for this Owner
Home Financials are based on the most recent Mortgage that was taken out on this home.
Original Mortgage
$60,000
Outstanding Balance
$41,727
Interest Rate
3.98%
Mortgage Type
New Conventional
Estimated Equity
$406,874
Purchase Details
Closed on
Oct 19, 2005
Sold by
Estate Of Verna Jessie Parsons and Cotteral Debra
Bought by
Ramirez Erfain
Purchase Details
Closed on
Oct 18, 2005
Sold by
Cotteral Debra L
Bought by
Ramirez Efrain and Ramirez Karina
Purchase Details
Closed on
Mar 20, 1997
Sold by
Mitchell Terry L and Mitchell Wendy M
Bought by
Parsons Verna J and Cotteral Debra L
Home Financials for this Owner
Home Financials are based on the most recent Mortgage that was taken out on this home.
Original Mortgage
$92,800
Interest Rate
7.63%
Mortgage Type
FHA
Create a Home Valuation Report for This Property
The Home Valuation Report is an in-depth analysis detailing your home's value as well as a comparison with similar homes in the area
Home Values in the Area
Average Home Value in this Area
Purchase History
| Date | Buyer | Sale Price | Title Company |
|---|---|---|---|
| Ramirez Efrain | -- | First American Title Ins | |
| Ramirez Erfain | $68,780 | Land Title Company | |
| Ramirez Efrain | $68,780 | Land Title Company | |
| Parsons Verna J | $92,800 | Transnation Title Ins |
Source: Public Records
Mortgage History
| Date | Status | Borrower | Loan Amount |
|---|---|---|---|
| Open | Ramirez Efrain | $60,000 | |
| Previous Owner | Parsons Verna J | $92,800 |
Source: Public Records
Tax History Compared to Growth
Tax History
| Year | Tax Paid | Tax Assessment Tax Assessment Total Assessment is a certain percentage of the fair market value that is determined by local assessors to be the total taxable value of land and additions on the property. | Land | Improvement |
|---|---|---|---|---|
| 2026 | $3,592 | $366,350 | $60,040 | $306,310 |
| 2025 | $3,592 | $391,150 | $60,280 | $330,870 |
| 2024 | $3,175 | $356,120 | $54,870 | $301,250 |
| 2023 | $2,989 | $329,570 | $54,870 | $274,700 |
| 2022 | $2,514 | $262,220 | $45,730 | $216,490 |
| 2021 | $2,500 | $238,660 | $41,570 | $197,090 |
| 2020 | $2,525 | $238,660 | $41,570 | $197,090 |
| 2019 | $2,316 | $218,880 | $34,930 | $183,950 |
| 2018 | $2,138 | $151,660 | $30,310 | $121,350 |
| 2017 | $1,841 | $151,660 | $30,310 | $121,350 |
| 2016 | $1,716 | $129,350 | $28,870 | $100,480 |
| 2015 | $1,703 | $129,350 | $28,870 | $100,480 |
| 2014 | -- | $127,030 | $28,870 | $98,160 |
| 2013 | -- | $145,450 | $52,650 | $92,800 |
Source: Public Records
Map
Nearby Homes
- 5655 NE Grove Ln
- 6106 NE State Highway 104
- 27442 State Highway 104 NE
- 27582 State Highway 104 NE
- 0 NE Verdant Dr
- 0 XXX Gamble Bay Rd NE
- 28xxx NE State Hwy 104
- 4457 NE Stevens Uhler Rd
- 6353 NE Gratitude Way
- 4493 NE Stevens Uhler Rd
- 7919 NE Sunnywoods Ln
- 7911 NE Sunnywoods Ln
- 29711 Gamble Place NE
- 24165 Port Gamble Rd NE
- 28005 Trillium Ln NE
- 23407 Marinwoon Circle Rd NE Unit 412
- 9590 NE Leprechaun Ln
- 9643 Goodfellow Ln NE
- 0 Barber Cut Off Rd NE
- 29722 State Highway 3 NE
- 27000 Wagner Cir NE
- 26968 Wagner Cir NE
- 26925 Frodesen Cir NE
- 26947 Frodesen Cir NE
- 27018 Wagner Cir NE
- 26954 Wagner Cir NE
- 26899 Frodesen Cir NE
- 26975 Wagner Cir NE
- 26993 Wagner Cir NE
- 26887 Frodesen Cir NE
- 26959 Wagner Cir NE
- 26938 Wagner Cir NE
- 27040 Wagner Cir NE
- 26991 Frodesen Cir NE
- 26943 Wagner Cir NE
- 26869 Frodesen Cir NE
- 27039 Wagner Cir NE
- 27056 Wagner Cir NE
- 26918 Wagner Cir NE