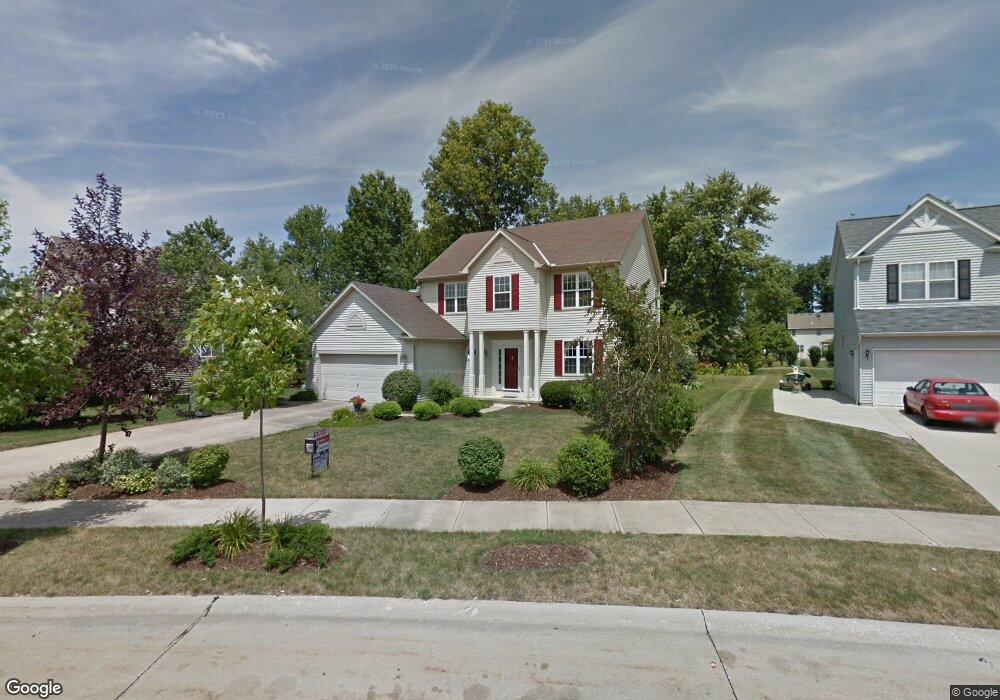
26988 Glenside Ln Olmsted Falls, OH 44138
Estimated Value: $382,855 - $449,000
4
Beds
3
Baths
2,100
Sq Ft
$194/Sq Ft
Est. Value
About This Home
This home is located at 26988 Glenside Ln, Olmsted Falls, OH 44138 and is currently estimated at $406,964, approximately $193 per square foot. 26988 Glenside Ln is a home located in Cuyahoga County with nearby schools including Olmsted Falls Intermediate Building, Falls-Lenox Primary Elementary School, and Olmsted Falls Middle School.
Ownership History
Date
Name
Owned For
Owner Type
Purchase Details
Closed on
Sep 13, 2011
Sold by
Hunsicker Timothy S and Hunsicker Cara E
Bought by
Fronek Jason Douglas and Fronek Laurie Jane
Current Estimated Value
Home Financials for this Owner
Home Financials are based on the most recent Mortgage that was taken out on this home.
Original Mortgage
$152,000
Outstanding Balance
$104,782
Interest Rate
4.4%
Mortgage Type
Purchase Money Mortgage
Estimated Equity
$302,182
Purchase Details
Closed on
Dec 11, 1997
Sold by
Shore West Construction Company
Bought by
Hunsicker Timothy S and Hunsicker Cara E
Home Financials for this Owner
Home Financials are based on the most recent Mortgage that was taken out on this home.
Original Mortgage
$179,000
Interest Rate
6.9%
Create a Home Valuation Report for This Property
The Home Valuation Report is an in-depth analysis detailing your home's value as well as a comparison with similar homes in the area
Home Values in the Area
Average Home Value in this Area
Purchase History
| Date | Buyer | Sale Price | Title Company |
|---|---|---|---|
| Fronek Jason Douglas | $190,000 | Stewart Title Agency | |
| Hunsicker Timothy S | $199,000 | Cleveland Title |
Source: Public Records
Mortgage History
| Date | Status | Borrower | Loan Amount |
|---|---|---|---|
| Open | Fronek Jason Douglas | $152,000 | |
| Previous Owner | Hunsicker Timothy S | $179,000 |
Source: Public Records
Tax History Compared to Growth
Tax History
| Year | Tax Paid | Tax Assessment Tax Assessment Total Assessment is a certain percentage of the fair market value that is determined by local assessors to be the total taxable value of land and additions on the property. | Land | Improvement |
|---|---|---|---|---|
| 2024 | $8,982 | $121,135 | $24,535 | $96,600 |
| 2023 | $8,343 | $91,430 | $20,550 | $70,880 |
| 2022 | $8,286 | $91,420 | $20,550 | $70,880 |
| 2021 | $8,211 | $91,420 | $20,550 | $70,880 |
| 2020 | $8,112 | $80,190 | $18,030 | $62,160 |
| 2019 | $7,348 | $229,100 | $51,500 | $177,600 |
| 2018 | $7,022 | $80,190 | $18,030 | $62,160 |
| 2017 | $6,453 | $67,620 | $17,500 | $50,120 |
| 2016 | $6,424 | $67,620 | $17,500 | $50,120 |
| 2015 | $6,316 | $67,620 | $17,500 | $50,120 |
| 2014 | $6,316 | $65,180 | $16,980 | $48,200 |
Source: Public Records
Map
Nearby Homes
- 7296 Chestnut Ct
- 7224 Pine Woods Way
- 7087 Mackenzie Rd
- 29 Carl Ln
- 26788 Skyline Dr
- 52 Periwinkle Dr
- 6926 Mackenzie Rd
- 7097 Stearns Rd
- 42 Periwinkle Dr
- 27069 Oakwood Cir Unit 117W
- 3 Fiddle Sticks
- 11 Concert Ct
- 8706 Stearns Rd
- 27097 Oakwood Cir Unit 208Z
- 3 Concert Ln
- 20 Van Ess Dr
- 16 Van Ess Dr
- 28130 Angela Dr
- 6706 Crestwood Ln
- 27202 Cook Rd Unit 95
- 26986 Glenside Ln
- 26990 Glenside Ln
- 26984 Glenside Ln
- 26991 Valeside Ln
- 26989 Valeside Ln
- 26980 Glenside Ln
- 26987 Valeside Ln
- 26995 Valeside Ln
- 26983 Glenside Ln
- 26981 Glenside Ln
- 26985 Valeside Ln
- 26987 Glenside Ln
- 26998 Glenside Ln
- 26977 Glenside Ln
- 26976 Glenside Ln
- 26991 Glenside Ln
- 26981 Valeside Ln
- 26999 Valeside Ln
- 26995 Glenside Ln
- 26973 Glenside Ln