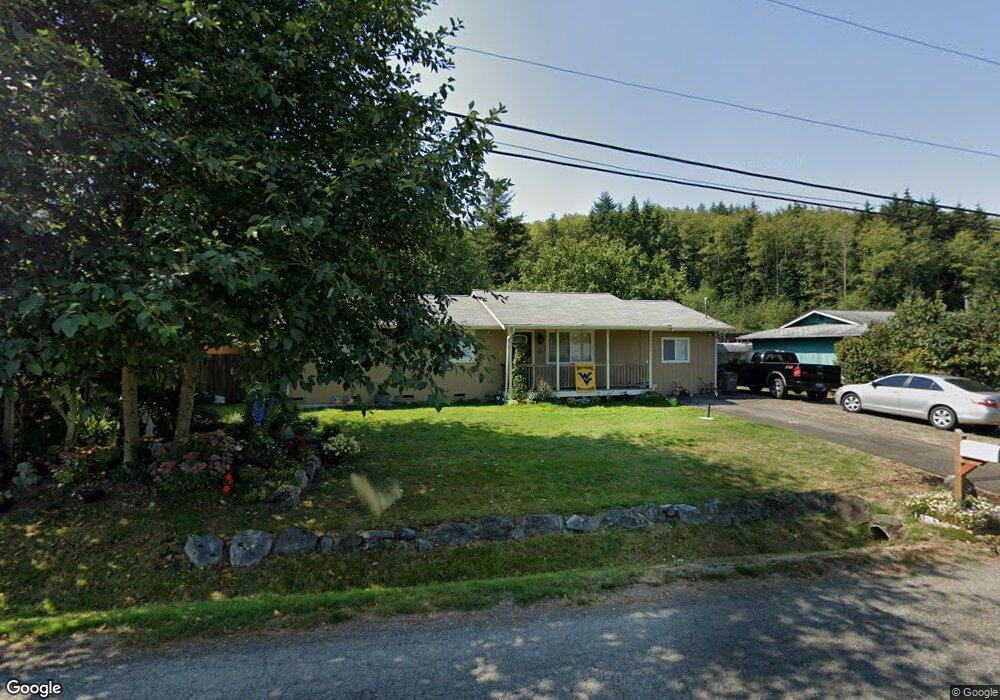
26989 Border Way NE Kingston, WA 98346
Estimated Value: $437,120 - $482,000
3
Beds
1
Bath
1,296
Sq Ft
$358/Sq Ft
Est. Value
About This Home
This home is located at 26989 Border Way NE, Kingston, WA 98346 and is currently estimated at $464,530, approximately $358 per square foot. 26989 Border Way NE is a home located in Kitsap County with nearby schools including David Wolfle Elementary School, Kingston Middle School, and Kingston High School.
Ownership History
Date
Name
Owned For
Owner Type
Purchase Details
Closed on
Dec 22, 2008
Sold by
Clarke Gordon and Clarke Joleen
Bought by
Rinear Kurt
Current Estimated Value
Home Financials for this Owner
Home Financials are based on the most recent Mortgage that was taken out on this home.
Original Mortgage
$195,000
Outstanding Balance
$128,657
Interest Rate
6.1%
Mortgage Type
VA
Estimated Equity
$335,873
Purchase Details
Closed on
Apr 15, 2005
Sold by
Wright Timothy and Wright Kathleen
Bought by
Clarke Gordon and Clarke Joleen
Home Financials for this Owner
Home Financials are based on the most recent Mortgage that was taken out on this home.
Original Mortgage
$135,200
Interest Rate
6.5%
Mortgage Type
Purchase Money Mortgage
Purchase Details
Closed on
Feb 23, 1999
Sold by
Sosbee Robert E and Ripley Tammie E
Bought by
Wright Timothy and Wright Kathleen
Home Financials for this Owner
Home Financials are based on the most recent Mortgage that was taken out on this home.
Original Mortgage
$79,008
Interest Rate
10.99%
Create a Home Valuation Report for This Property
The Home Valuation Report is an in-depth analysis detailing your home's value as well as a comparison with similar homes in the area
Home Values in the Area
Average Home Value in this Area
Purchase History
| Date | Buyer | Sale Price | Title Company |
|---|---|---|---|
| Rinear Kurt | $195,280 | First American Title Ins Co | |
| Clarke Gordon | $169,000 | Transnation Title | |
| Wright Timothy | $92,950 | Land Title Company |
Source: Public Records
Mortgage History
| Date | Status | Borrower | Loan Amount |
|---|---|---|---|
| Open | Rinear Kurt | $195,000 | |
| Previous Owner | Clarke Gordon | $135,200 | |
| Previous Owner | Wright Timothy | $79,008 | |
| Closed | Wright Timothy | $9,295 |
Source: Public Records
Tax History Compared to Growth
Tax History
| Year | Tax Paid | Tax Assessment Tax Assessment Total Assessment is a certain percentage of the fair market value that is determined by local assessors to be the total taxable value of land and additions on the property. | Land | Improvement |
|---|---|---|---|---|
| 2026 | $3,725 | $377,660 | $65,000 | $312,660 |
| 2025 | $3,725 | $406,230 | $65,250 | $340,980 |
| 2024 | $3,293 | $369,860 | $59,400 | $310,460 |
| 2023 | $3,102 | $342,500 | $59,400 | $283,100 |
| 2022 | $2,609 | $272,610 | $49,500 | $223,110 |
| 2021 | $2,594 | $248,110 | $45,000 | $203,110 |
| 2020 | $2,620 | $248,110 | $45,000 | $203,110 |
| 2019 | $2,392 | $226,430 | $37,510 | $188,920 |
| 2018 | $2,209 | $157,180 | $32,550 | $124,630 |
| 2017 | $1,905 | $157,180 | $32,550 | $124,630 |
| 2016 | $1,777 | $134,190 | $31,000 | $103,190 |
| 2015 | $1,763 | $134,190 | $31,000 | $103,190 |
| 2014 | -- | $131,810 | $31,000 | $100,810 |
| 2013 | -- | $153,450 | $52,650 | $100,800 |
Source: Public Records
Map
Nearby Homes
- 5655 NE Grove Ln
- 6106 NE State Highway 104
- 27442 State Highway 104 NE
- 27582 State Highway 104 NE
- 0 NE Verdant Dr
- 0 XXX Gamble Bay Rd NE
- 28xxx NE State Hwy 104
- 4457 NE Stevens Uhler Rd
- 4493 NE Stevens Uhler Rd
- 6353 NE Gratitude Way
- 7919 NE Sunnywoods Ln
- 7911 NE Sunnywoods Ln
- 29711 Gamble Place NE
- 24165 Port Gamble Rd NE
- 28005 Trillium Ln NE
- 23407 Marinwoon Circle Rd NE Unit 412
- 9590 NE Leprechaun Ln
- 9643 Goodfellow Ln NE
- 0 Barber Cut Off Rd NE
- 29722 State Highway 3 NE
- 27003 Border Way NE
- 26965 Border Way NE
- 26908 State Highway 104 NE
- 26949 Border Way NE
- 26985 Border Way NE
- 26999 Woodside Rd NE
- 26929 Border Way NE
- 27008 Woodside Rd NE
- 27019 Woodside Rd NE
- 26929 Wagner Cir NE
- 26928 Border Way NE
- 27082 Meadow Cir NE
- 27022 Woodside Rd NE
- 26943 Wagner Cir NE
- 27047 Woodside Rd NE
- 26959 Wagner Cir NE
- 27040 Woodside Rd NE
- 0 Resource Ridge Rd NE
- 27102 Meadow Cir NE