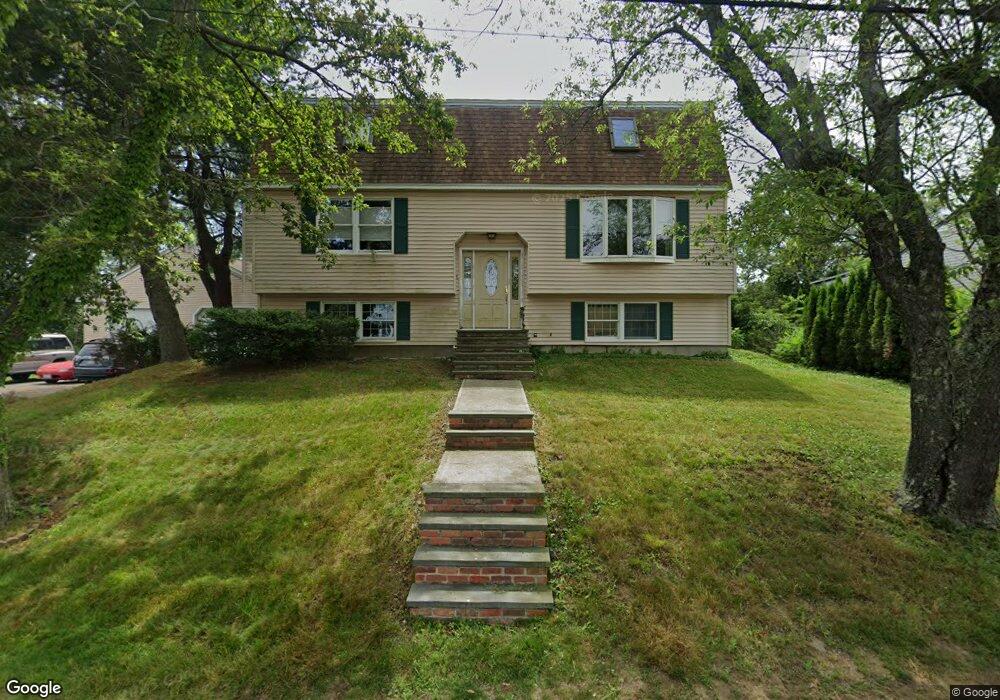
27 1/2 Crowdis St Salem, MA 01970
Witchcraft Heights NeighborhoodEstimated Value: $741,000 - $823,000
3
Beds
2
Baths
2,222
Sq Ft
$353/Sq Ft
Est. Value
About This Home
This home is located at 27 1/2 Crowdis St, Salem, MA 01970 and is currently estimated at $783,484, approximately $352 per square foot. 27 1/2 Crowdis St is a home located in Essex County with nearby schools including Horace Mann Laboratory, Witchcraft Heights Elementary School, and Saltonstall School.
Ownership History
Date
Name
Owned For
Owner Type
Purchase Details
Closed on
May 15, 2023
Sold by
Pascarella Anthony J and Pascarella Sandra J
Bought by
Anthony J Pascarella Ft and Pascarella
Current Estimated Value
Purchase Details
Closed on
Oct 17, 2018
Sold by
Pascarella Anthony J and Pascarella Sandra J
Bought by
2712 Crowdis Salem Rt and Pascarella
Purchase Details
Closed on
Sep 4, 2018
Sold by
27 Crowdis Salem Rt and Pascarella
Bought by
Pascarella Anthony J and Pascarella Sandra J
Purchase Details
Closed on
Jul 2, 2018
Sold by
Pascarella Anthony J and Pascarella Sandr A
Bought by
27 12 Crowds Salem Rt and Pascarella
Create a Home Valuation Report for This Property
The Home Valuation Report is an in-depth analysis detailing your home's value as well as a comparison with similar homes in the area
Home Values in the Area
Average Home Value in this Area
Purchase History
| Date | Buyer | Sale Price | Title Company |
|---|---|---|---|
| Anthony J Pascarella Ft | -- | None Available | |
| Pascarella Anthony J | -- | None Available | |
| 2712 Crowdis Salem Rt | -- | -- | |
| Pascarella Anthony J | -- | -- | |
| 27 12 Crowds Salem Rt | -- | -- |
Source: Public Records
Tax History Compared to Growth
Tax History
| Year | Tax Paid | Tax Assessment Tax Assessment Total Assessment is a certain percentage of the fair market value that is determined by local assessors to be the total taxable value of land and additions on the property. | Land | Improvement |
|---|---|---|---|---|
| 2025 | $8,045 | $709,400 | $266,000 | $443,400 |
| 2024 | $7,817 | $672,700 | $251,100 | $421,600 |
| 2023 | $7,423 | $593,400 | $229,700 | $363,700 |
| 2022 | $7,117 | $537,100 | $211,900 | $325,200 |
| 2021 | $7,086 | $513,500 | $197,700 | $315,800 |
| 2020 | $7,237 | $500,800 | $194,100 | $306,700 |
| 2019 | $7,077 | $468,700 | $183,400 | $285,300 |
| 2018 | $7,144 | $464,500 | $172,000 | $292,500 |
| 2017 | $7,032 | $443,400 | $162,000 | $281,400 |
| 2016 | $6,948 | $443,400 | $162,000 | $281,400 |
| 2015 | $6,712 | $409,000 | $144,200 | $264,800 |
Source: Public Records
Map
Nearby Homes