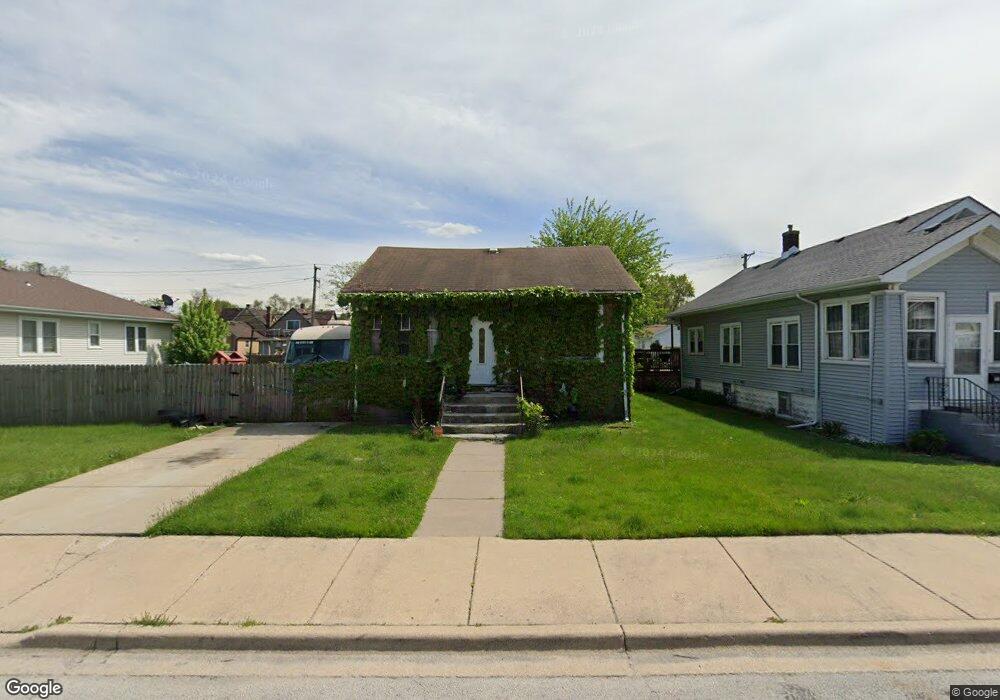
27 156th Place Calumet City, IL 60409
Estimated Value: $107,000 - $154,000
3
Beds
1
Bath
1,250
Sq Ft
$111/Sq Ft
Est. Value
About This Home
This home is located at 27 156th Place, Calumet City, IL 60409 and is currently estimated at $139,038, approximately $111 per square foot. 27 156th Place is a home located in Cook County with nearby schools including Lincoln Elementary School, Thornton Fractional North High School, and Hammond Academy Of Science & Tech.
Ownership History
Date
Name
Owned For
Owner Type
Purchase Details
Closed on
Feb 24, 2015
Sold by
Stonecrest Income & Opportunity Fund I L
Bought by
Rodriguez Amaris
Current Estimated Value
Purchase Details
Closed on
May 18, 2011
Sold by
Wells Fargo Bank Na
Bought by
Stonecrest Income & Opportunity Fund I L
Purchase Details
Closed on
May 12, 2009
Sold by
Delnagro Michael J
Bought by
Wells Fargo Bank Na
Purchase Details
Closed on
Sep 21, 2007
Sold by
First National Bank Of Illinois
Bought by
Mjjm Properties Llc
Purchase Details
Closed on
May 4, 2007
Sold by
Delnagro Michael J and Delnagro Wilma M
Bought by
First National Bank Of Illinois and Trust #6113
Purchase Details
Closed on
Sep 13, 2006
Sold by
Delnagro Michael J
Bought by
Delnagro Michael J and Delnagro Wilma M
Purchase Details
Closed on
May 12, 2006
Sold by
Couture Harold and Couture Angeline
Bought by
Delnagro Michael J
Create a Home Valuation Report for This Property
The Home Valuation Report is an in-depth analysis detailing your home's value as well as a comparison with similar homes in the area
Home Values in the Area
Average Home Value in this Area
Purchase History
| Date | Buyer | Sale Price | Title Company |
|---|---|---|---|
| Rodriguez Amaris | $3,500 | None Available | |
| Stonecrest Income & Opportunity Fund I L | $5,228 | None Available | |
| Wells Fargo Bank Na | -- | None Available | |
| Mjjm Properties Llc | -- | Ticor Title | |
| First National Bank Of Illinois | -- | None Available | |
| Delnagro Michael J | -- | None Available | |
| Delnagro Michael J | $41,000 | Pntn |
Source: Public Records
Tax History Compared to Growth
Tax History
| Year | Tax Paid | Tax Assessment Tax Assessment Total Assessment is a certain percentage of the fair market value that is determined by local assessors to be the total taxable value of land and additions on the property. | Land | Improvement |
|---|---|---|---|---|
| 2024 | $2,038 | $7,000 | $1,830 | $5,170 |
| 2023 | $2,255 | $7,000 | $1,830 | $5,170 |
| 2022 | $2,255 | $6,536 | $1,601 | $4,935 |
| 2021 | $1,507 | $6,535 | $1,601 | $4,934 |
| 2020 | $1,507 | $6,535 | $1,601 | $4,934 |
| 2019 | $1,533 | $5,550 | $1,486 | $4,064 |
| 2018 | $1,507 | $5,550 | $1,486 | $4,064 |
| 2017 | $1,493 | $5,550 | $1,486 | $4,064 |
| 2016 | $2,148 | $5,819 | $1,372 | $4,447 |
| 2015 | $0 | $5,819 | $1,372 | $4,447 |
| 2014 | $2,027 | $5,819 | $1,372 | $4,447 |
| 2013 | $2,142 | $6,411 | $1,372 | $5,039 |
Source: Public Records
Map
Nearby Homes