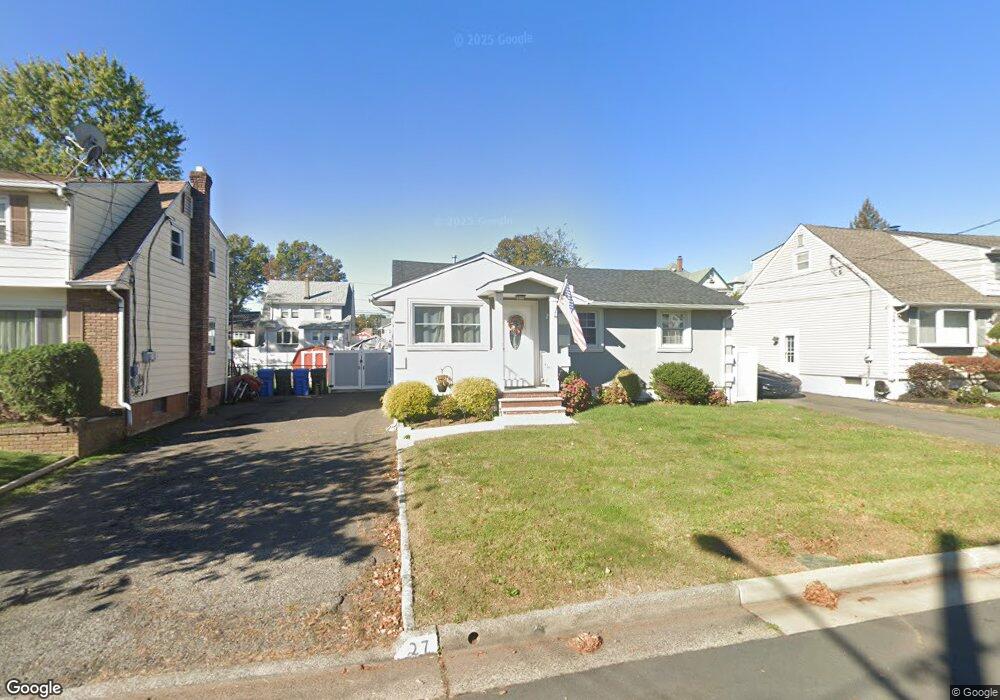
27 2nd Ave Port Reading, NJ 07064
Estimated Value: $503,336 - $634,000
3
Beds
2
Baths
1,943
Sq Ft
$285/Sq Ft
Est. Value
About This Home
This home is located at 27 2nd Ave, Port Reading, NJ 07064 and is currently estimated at $553,084, approximately $284 per square foot. 27 2nd Ave is a home located in Middlesex County with nearby schools including Matthew Jago Elementary School, Avenel Middle School, and Woodbridge High School.
Ownership History
Date
Name
Owned For
Owner Type
Purchase Details
Closed on
Apr 4, 2019
Sold by
Singh Hardeep
Bought by
Felix Jose and Felix Nelly
Current Estimated Value
Purchase Details
Closed on
Apr 12, 2018
Sold by
Fannie Mae
Bought by
Singh Hardeep
Purchase Details
Closed on
Oct 19, 2017
Sold by
Wilmington Savings Fund Society
Bought by
Federal National Mortgage Association
Purchase Details
Closed on
May 17, 2017
Sold by
Delatorre Veroslavsky Claudia M
Bought by
Wilmington Saving Fund Socierty and Christina Trust
Purchase Details
Closed on
Jul 23, 2003
Create a Home Valuation Report for This Property
The Home Valuation Report is an in-depth analysis detailing your home's value as well as a comparison with similar homes in the area
Home Values in the Area
Average Home Value in this Area
Purchase History
| Date | Buyer | Sale Price | Title Company |
|---|---|---|---|
| Felix Jose | $335,000 | Simplicity Title Llc | |
| Singh Hardeep | $154,000 | None Available | |
| Federal National Mortgage Association | -- | None Available | |
| Wilmington Saving Fund Socierty | -- | None Available | |
| -- | $202,500 | -- |
Source: Public Records
Tax History Compared to Growth
Tax History
| Year | Tax Paid | Tax Assessment Tax Assessment Total Assessment is a certain percentage of the fair market value that is determined by local assessors to be the total taxable value of land and additions on the property. | Land | Improvement |
|---|---|---|---|---|
| 2025 | $9,792 | $73,500 | $18,000 | $55,500 |
| 2024 | $9,507 | $73,500 | $18,000 | $55,500 |
| 2023 | $9,507 | $73,500 | $18,000 | $55,500 |
| 2022 | $9,272 | $73,500 | $18,000 | $55,500 |
| 2021 | $8,899 | $73,500 | $18,000 | $55,500 |
| 2020 | $8,602 | $73,500 | $18,000 | $55,500 |
| 2019 | $5,162 | $45,400 | $18,000 | $27,400 |
| 2018 | $5,058 | $45,400 | $18,000 | $27,400 |
| 2017 | $4,956 | $45,400 | $18,000 | $27,400 |
| 2016 | $6,592 | $61,000 | $18,000 | $43,000 |
| 2015 | $6,456 | $61,000 | $18,000 | $43,000 |
| 2014 | $6,290 | $61,000 | $18,000 | $43,000 |
Source: Public Records
Map
Nearby Homes