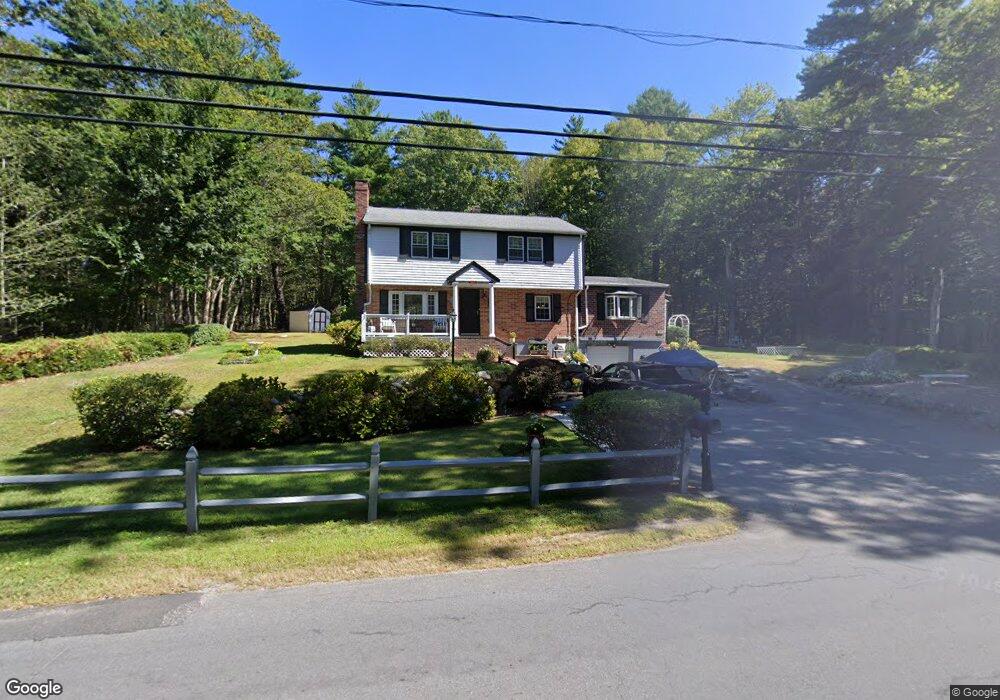
27 Abington St Hingham, MA 02043
South Hingham NeighborhoodEstimated Value: $752,000 - $789,000
3
Beds
2
Baths
2,096
Sq Ft
$366/Sq Ft
Est. Value
About This Home
This home is located at 27 Abington St, Hingham, MA 02043 and is currently estimated at $767,415, approximately $366 per square foot. 27 Abington St is a home located in Plymouth County with nearby schools including South Elementary School, Hingham Middle School, and Hingham High School.
Ownership History
Date
Name
Owned For
Owner Type
Purchase Details
Closed on
Mar 3, 2015
Sold by
Salvucci Mark and Salvucci Maureen
Bought by
Salvucci Maureen and Salvucci Mark
Current Estimated Value
Home Financials for this Owner
Home Financials are based on the most recent Mortgage that was taken out on this home.
Original Mortgage
$98,500
Outstanding Balance
$35,395
Interest Rate
3.66%
Mortgage Type
New Conventional
Estimated Equity
$732,020
Purchase Details
Closed on
Apr 16, 1993
Sold by
Masciulli Frank J and Masciulli Pearl R
Bought by
Salvucci Mark and Walsh Maureen
Home Financials for this Owner
Home Financials are based on the most recent Mortgage that was taken out on this home.
Original Mortgage
$134,000
Interest Rate
7.39%
Mortgage Type
Purchase Money Mortgage
Create a Home Valuation Report for This Property
The Home Valuation Report is an in-depth analysis detailing your home's value as well as a comparison with similar homes in the area
Home Values in the Area
Average Home Value in this Area
Purchase History
| Date | Buyer | Sale Price | Title Company |
|---|---|---|---|
| Salvucci Maureen | -- | -- | |
| Salvucci Mark | $149,000 | -- |
Source: Public Records
Mortgage History
| Date | Status | Borrower | Loan Amount |
|---|---|---|---|
| Open | Salvucci Maureen | $98,500 | |
| Previous Owner | Salvucci Mark | $134,000 | |
| Previous Owner | Salvucci Mark | $27,000 |
Source: Public Records
Tax History Compared to Growth
Tax History
| Year | Tax Paid | Tax Assessment Tax Assessment Total Assessment is a certain percentage of the fair market value that is determined by local assessors to be the total taxable value of land and additions on the property. | Land | Improvement |
|---|---|---|---|---|
| 2025 | $6,652 | $622,300 | $277,300 | $345,000 |
| 2024 | $6,426 | $592,300 | $277,300 | $315,000 |
| 2023 | $5,634 | $563,400 | $277,300 | $286,100 |
| 2022 | $5,697 | $492,800 | $250,300 | $242,500 |
| 2021 | $5,745 | $486,900 | $250,300 | $236,600 |
| 2020 | $5,614 | $486,900 | $250,300 | $236,600 |
| 2019 | $5,572 | $471,800 | $250,300 | $221,500 |
| 2018 | $5,553 | $471,800 | $250,300 | $221,500 |
| 2017 | $4,880 | $398,400 | $205,200 | $193,200 |
| 2016 | $4,854 | $388,600 | $195,400 | $193,200 |
| 2015 | $4,513 | $360,200 | $186,100 | $174,100 |
Source: Public Records
Map
Nearby Homes
- 31 Abington St
- 19 Abington St
- 36 Abington St
- 17 Abington St
- 4 Dennis Rd
- 41 Abington St
- 0 Abington St
- 40 Abington St
- 5 Dennis Rd
- 3 Dennis Rd
- 2 Dennis Rd
- 1 Dennis Rd
- 0 Dennis Rd Unit 2 71019998
- 0 Dennis Rd Unit 3 71019999
- 0 Dennis Rd Unit 4 71033517
- 0 Dennis Rd Unit 72969359
- 0 Dennis Rd Unit 72934639
- 0 Dennis Rd Unit 72879492
- 0 Dennis Rd Unit 1 71019996
- 15 Abington St