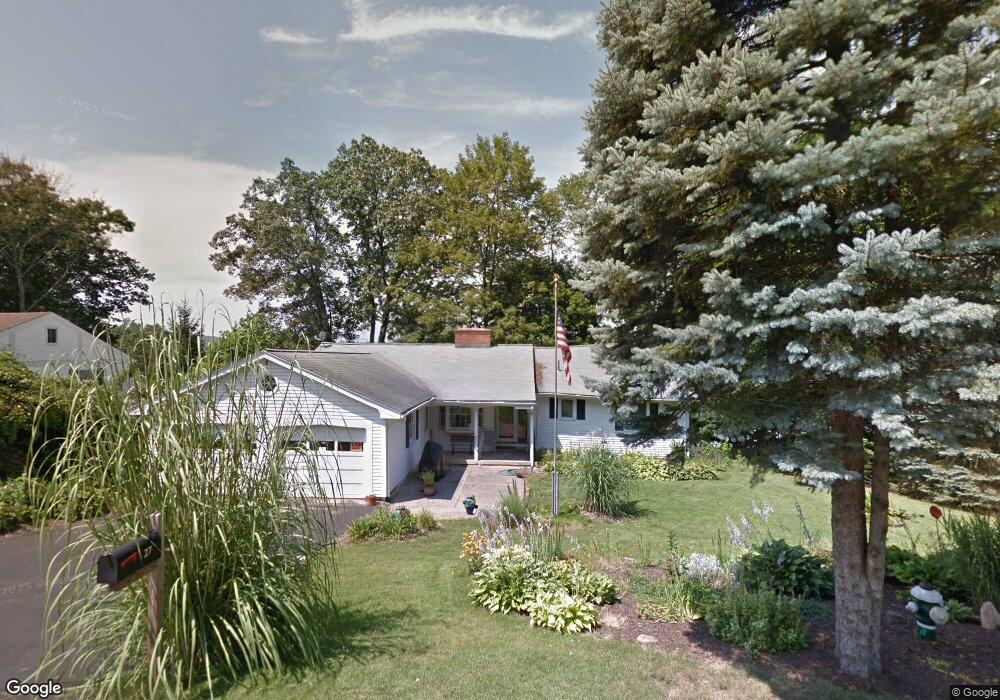
27 Albion St Naugatuck, CT 06770
Estimated Value: $375,912 - $410,000
3
Beds
2
Baths
1,623
Sq Ft
$244/Sq Ft
Est. Value
About This Home
This home is located at 27 Albion St, Naugatuck, CT 06770 and is currently estimated at $396,728, approximately $244 per square foot. 27 Albion St is a home located in New Haven County with nearby schools including City Hill Middle School and Naugatuck High School.
Ownership History
Date
Name
Owned For
Owner Type
Purchase Details
Closed on
Oct 30, 2008
Sold by
Uszakiewicz Casmir P
Bought by
Uszakiewicz David A
Current Estimated Value
Home Financials for this Owner
Home Financials are based on the most recent Mortgage that was taken out on this home.
Original Mortgage
$78,400
Outstanding Balance
$50,824
Interest Rate
5.83%
Mortgage Type
Purchase Money Mortgage
Estimated Equity
$345,904
Purchase Details
Closed on
May 9, 2006
Sold by
Uszakiewicz Charles and Clark Lynn
Bought by
Uszakiewicz Casmir P
Create a Home Valuation Report for This Property
The Home Valuation Report is an in-depth analysis detailing your home's value as well as a comparison with similar homes in the area
Home Values in the Area
Average Home Value in this Area
Purchase History
| Date | Buyer | Sale Price | Title Company |
|---|---|---|---|
| Uszakiewicz David A | $98,000 | -- | |
| Uszakiewicz Casmir P | $140,000 | -- |
Source: Public Records
Mortgage History
| Date | Status | Borrower | Loan Amount |
|---|---|---|---|
| Open | Uszakiewicz Casmir P | $78,400 |
Source: Public Records
Tax History
| Year | Tax Paid | Tax Assessment Tax Assessment Total Assessment is a certain percentage of the fair market value that is determined by local assessors to be the total taxable value of land and additions on the property. | Land | Improvement |
|---|---|---|---|---|
| 2025 | $8,247 | $207,270 | $30,030 | $177,240 |
| 2024 | $8,662 | $207,270 | $30,030 | $177,240 |
| 2023 | $9,275 | $207,270 | $30,030 | $177,240 |
| 2022 | $6,560 | $137,390 | $32,210 | $105,180 |
| 2021 | $6,560 | $137,390 | $32,210 | $105,180 |
| 2020 | $6,560 | $137,390 | $32,210 | $105,180 |
| 2019 | $6,492 | $137,390 | $32,210 | $105,180 |
| 2018 | $6,085 | $125,860 | $38,750 | $87,110 |
| 2017 | $6,244 | $128,600 | $38,750 | $89,850 |
| 2016 | $6,130 | $128,600 | $38,750 | $89,850 |
| 2015 | $5,860 | $128,600 | $38,750 | $89,850 |
| 2014 | $5,795 | $128,600 | $38,750 | $89,850 |
| 2012 | $6,052 | $180,400 | $48,930 | $131,470 |
Source: Public Records
Map
Nearby Homes
- 210 Johnson St
- 190 Auburn St
- 163 City Hill St
- 231 N Main St
- 121 Johnson St
- 119 Prospect St
- 51 Brook St Unit 6A
- 51 Brook St Unit 3B
- 137 Lincoln St
- 465 N Main St
- 32 Stanley St
- 111 Wooster St Unit 4A
- 3 Maple Terrace
- 85 Cold Spring Cir
- 48 Anderson St
- 23 Salem St
- 18 Bridge St Unit 1O
- 41 Millville Ave Unit 201
- 22 Neagle St
- 25 Tyler Hill Rd
Your Personal Tour Guide
Ask me questions while you tour the home.