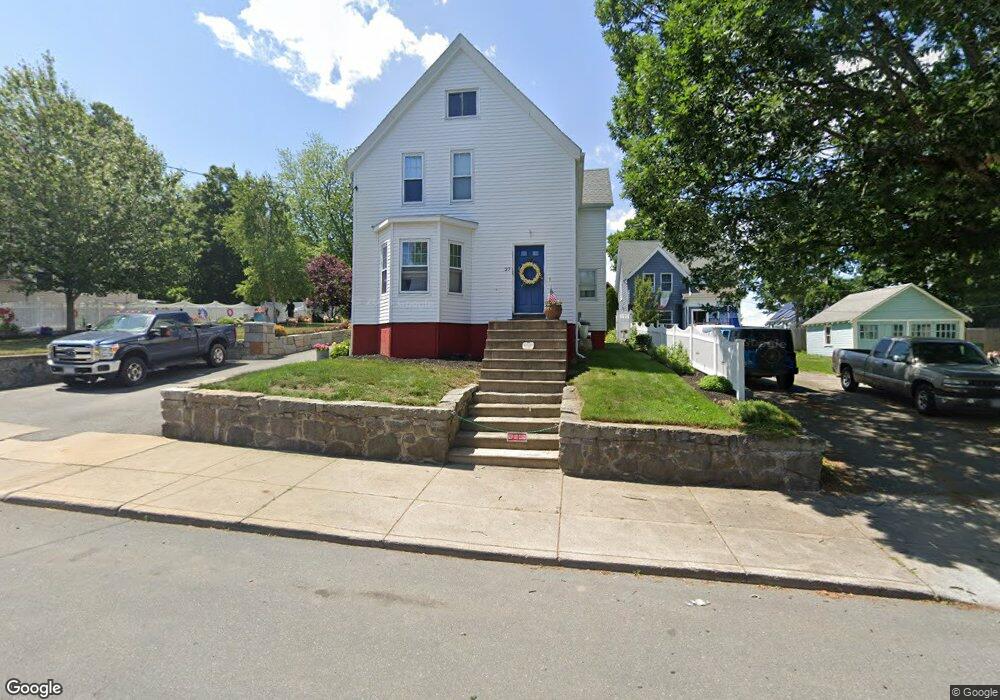
27 Allen Ave Lynn, MA 01902
Agganis AC NeighborhoodEstimated Value: $285,000 - $795,000
4
Beds
3
Baths
2,178
Sq Ft
$306/Sq Ft
Est. Value
About This Home
This home is located at 27 Allen Ave, Lynn, MA 01902 and is currently estimated at $665,947, approximately $305 per square foot. 27 Allen Ave is a home located in Essex County with nearby schools including Robert L. Ford Elementary School, William R. Fallon School, and Marshall Middle School.
Ownership History
Date
Name
Owned For
Owner Type
Purchase Details
Closed on
Sep 5, 2024
Sold by
Johnson Dianne J and Johnson Wayne A
Bought by
Johnson Ft and Cross
Current Estimated Value
Purchase Details
Closed on
Jul 1, 1985
Bought by
Johnson Wayne A and Johnson Dianne J
Create a Home Valuation Report for This Property
The Home Valuation Report is an in-depth analysis detailing your home's value as well as a comparison with similar homes in the area
Home Values in the Area
Average Home Value in this Area
Purchase History
| Date | Buyer | Sale Price | Title Company |
|---|---|---|---|
| Johnson Ft | -- | None Available | |
| Johnson Ft | -- | None Available | |
| Johnson Ft | -- | None Available | |
| Johnson Ft | -- | None Available | |
| Johnson Wayne A | $155,500 | -- |
Source: Public Records
Mortgage History
| Date | Status | Borrower | Loan Amount |
|---|---|---|---|
| Previous Owner | Johnson Wayne A | $320,000 | |
| Previous Owner | Johnson Wayne A | $155,000 | |
| Previous Owner | Johnson Wayne A | $100,000 |
Source: Public Records
Tax History
| Year | Tax Paid | Tax Assessment Tax Assessment Total Assessment is a certain percentage of the fair market value that is determined by local assessors to be the total taxable value of land and additions on the property. | Land | Improvement |
|---|---|---|---|---|
| 2025 | $8,197 | $791,241 | $230,400 | $560,841 |
| 2024 | $7,665 | $727,900 | $208,000 | $519,900 |
| 2023 | $7,720 | $692,400 | $208,000 | $484,400 |
| 2022 | $7,714 | $620,600 | $170,100 | $450,500 |
| 2021 | $7,269 | $557,900 | $155,100 | $402,800 |
| 2020 | $6,447 | $481,100 | $121,200 | $359,900 |
| 2019 | $6,331 | $442,700 | $118,200 | $324,500 |
| 2018 | $5,907 | $389,900 | $114,200 | $275,700 |
| 2017 | $5,206 | $333,700 | $88,800 | $244,900 |
| 2016 | $4,734 | $292,600 | $74,800 | $217,800 |
| 2015 | $4,606 | $275,000 | $80,300 | $194,700 |
Source: Public Records
Map
Nearby Homes
Your Personal Tour Guide
Ask me questions while you tour the home.