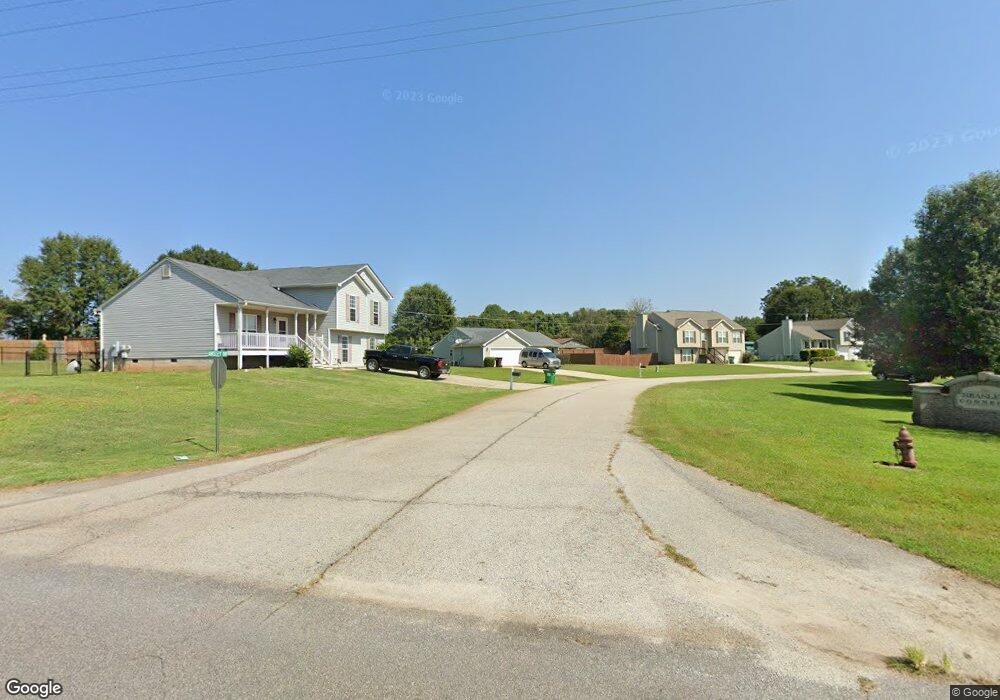
27 Ansley Dr Unit 4 Lavonia, GA 30553
Estimated Value: $230,000 - $300,000
3
Beds
2
Baths
1,406
Sq Ft
$183/Sq Ft
Est. Value
About This Home
This home is located at 27 Ansley Dr Unit 4, Lavonia, GA 30553 and is currently estimated at $256,894, approximately $182 per square foot. 27 Ansley Dr Unit 4 is a home located in Franklin County with nearby schools including Franklin County High School.
Ownership History
Date
Name
Owned For
Owner Type
Purchase Details
Closed on
Oct 1, 2015
Sold by
Bennett James B
Bought by
Watson Bobby D
Current Estimated Value
Home Financials for this Owner
Home Financials are based on the most recent Mortgage that was taken out on this home.
Original Mortgage
$76,000
Outstanding Balance
$59,897
Interest Rate
3.93%
Mortgage Type
New Conventional
Estimated Equity
$196,997
Purchase Details
Closed on
Dec 18, 2012
Sold by
Southfork Homes Llc
Bought by
Bennett James B
Home Financials for this Owner
Home Financials are based on the most recent Mortgage that was taken out on this home.
Original Mortgage
$93,877
Interest Rate
3.35%
Mortgage Type
New Conventional
Purchase Details
Closed on
Jun 11, 2012
Sold by
Pinnacle Bank
Bought by
Southfork Homes Llc
Purchase Details
Closed on
Dec 7, 2010
Sold by
Link Sales
Bought by
Pinnacle Bank
Purchase Details
Closed on
Feb 14, 2008
Sold by
Not Provided
Bought by
Pinnacle Bank
Create a Home Valuation Report for This Property
The Home Valuation Report is an in-depth analysis detailing your home's value as well as a comparison with similar homes in the area
Home Values in the Area
Average Home Value in this Area
Purchase History
| Date | Buyer | Sale Price | Title Company |
|---|---|---|---|
| Watson Bobby D | $95,000 | -- | |
| Bennett James B | $91,100 | -- | |
| Southfork Homes Llc | $25,025 | -- | |
| Pinnacle Bank | $1,166,000 | -- | |
| Pinnacle Bank | -- | -- |
Source: Public Records
Mortgage History
| Date | Status | Borrower | Loan Amount |
|---|---|---|---|
| Open | Watson Bobby D | $76,000 | |
| Previous Owner | Bennett James B | $93,877 |
Source: Public Records
Tax History Compared to Growth
Tax History
| Year | Tax Paid | Tax Assessment Tax Assessment Total Assessment is a certain percentage of the fair market value that is determined by local assessors to be the total taxable value of land and additions on the property. | Land | Improvement |
|---|---|---|---|---|
| 2024 | $1,878 | $78,912 | $8,000 | $70,912 |
| 2023 | $1,870 | $72,466 | $8,000 | $64,466 |
| 2022 | $1,718 | $66,583 | $8,000 | $58,583 |
| 2021 | $1,544 | $56,108 | $5,600 | $50,508 |
| 2020 | $1,327 | $47,720 | $2,000 | $45,720 |
| 2019 | $1,282 | $47,720 | $2,000 | $45,720 |
| 2018 | $1,370 | $51,011 | $2,000 | $49,011 |
| 2017 | $1,151 | $41,209 | $2,000 | $39,209 |
| 2016 | $1,061 | $36,368 | $2,000 | $34,368 |
| 2015 | -- | $36,368 | $2,000 | $34,368 |
| 2014 | -- | $36,368 | $2,000 | $34,368 |
| 2013 | -- | $36,726 | $2,000 | $34,726 |
Source: Public Records
Map
Nearby Homes
- 125 Charity Dr
- 56 Harriet Dr
- 68 Harriet Dr
- 181 Charity Dr
- 222 Charity Dr
- 3434 Highway 59
- 104 Powers Rd
- 148 Allen Dr
- 138 Victoria Ln
- 59 Wright St Unit 69
- 0 Hwy 59 and Ross Place Unit 10499138
- 1320 Franklin Co Boat Ramp Rd
- 89 Huntington Dr
- 271 Harbor Light Marina Rd
- 49 Wright St Unit 65
- 55 Wright St Unit 67
- 57 Wright St Unit 68
- 51 Wright St Unit 66
- 45 Wright St Unit 64
- 346 Park Place Dr Unit LOT 5
- 27 Ansley Dr
- 13 Ansley Dr Unit Lot 3
- 13 Ansley Dr Unit 3
- 13 Ansley Dr
- 45 Ansley Dr
- 3107 Highway 59
- 3125 Highway 59
- 1316 Beasley Rd
- 65 Ansley Dr Unit 6
- 65 Ansley Dr
- 46 Ansley Dr
- 3073 Highway 59
- 3073 Georgia 59
- 1010 Beasley Rd
- 76 Ansley Dr
- 85 Ansley Dr Unit 7
- 85 Ansley Dr
- 3057 Highway 59
- 1220 Beasley Rd
- 1273 Beasley Rd