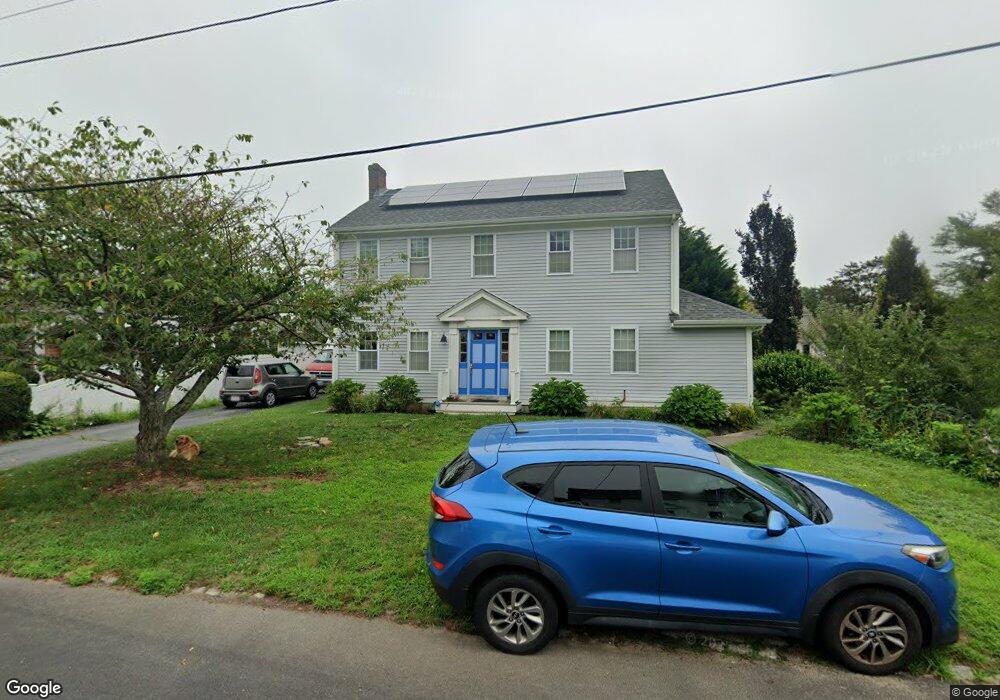
27 Anthony St South Dartmouth, MA 02748
Dartmouth Community Park NeighborhoodEstimated Value: $729,652 - $912,000
4
Beds
1
Bath
1,435
Sq Ft
$570/Sq Ft
Est. Value
About This Home
This home is located at 27 Anthony St, South Dartmouth, MA 02748 and is currently estimated at $818,663, approximately $570 per square foot. 27 Anthony St is a home located in Bristol County with nearby schools including Dartmouth High School and St. Teresa of Calcutta School.
Ownership History
Date
Name
Owned For
Owner Type
Purchase Details
Closed on
Mar 8, 2001
Sold by
Most Marguerite I
Bought by
Fifield Ann W and Borim Dario
Current Estimated Value
Purchase Details
Closed on
Dec 11, 1998
Sold by
Singleton Thomas F and Singleton Joseph
Bought by
Most Marguerite I
Create a Home Valuation Report for This Property
The Home Valuation Report is an in-depth analysis detailing your home's value as well as a comparison with similar homes in the area
Home Values in the Area
Average Home Value in this Area
Purchase History
| Date | Buyer | Sale Price | Title Company |
|---|---|---|---|
| Fifield Ann W | $185,000 | -- | |
| Most Marguerite I | $150,000 | -- |
Source: Public Records
Mortgage History
| Date | Status | Borrower | Loan Amount |
|---|---|---|---|
| Open | Most Marguerite I | $320,500 | |
| Closed | Most Marguerite I | $328,000 | |
| Closed | Most Marguerite I | $320,000 |
Source: Public Records
Tax History Compared to Growth
Tax History
| Year | Tax Paid | Tax Assessment Tax Assessment Total Assessment is a certain percentage of the fair market value that is determined by local assessors to be the total taxable value of land and additions on the property. | Land | Improvement |
|---|---|---|---|---|
| 2025 | $5,099 | $592,200 | $267,700 | $324,500 |
| 2024 | $5,042 | $580,200 | $267,700 | $312,500 |
| 2023 | $4,828 | $526,500 | $237,900 | $288,600 |
| 2022 | $4,720 | $476,800 | $237,900 | $238,900 |
| 2021 | $4,702 | $453,900 | $207,900 | $246,000 |
| 2020 | $4,809 | $463,300 | $228,600 | $234,700 |
| 2019 | $4,570 | $439,400 | $218,300 | $221,100 |
| 2018 | $4,324 | $427,400 | $218,300 | $209,100 |
| 2017 | $4,227 | $421,900 | $210,300 | $211,600 |
| 2016 | $4,051 | $398,700 | $210,300 | $188,400 |
| 2015 | $3,894 | $384,000 | $193,400 | $190,600 |
| 2014 | $3,711 | $363,500 | $177,300 | $186,200 |
Source: Public Records
Map
Nearby Homes
- 40 School St
- 0 Stoneledge Rd
- 00 Prospect St
- 23 High St
- 2 Spinnaker Ln
- 179 Rockland St
- 48 Wilson St
- 21 Avis St
- 76 Shipyard Ln
- 59 Hidden Bay Dr
- 212 Rockland St
- 15 Puritan St
- 18 Saint John St
- 1 Walter St
- 0 East Ave Unit 73382206
- 75 Country Way Unit 75
- 3 Mishawum Dr
- 5 Samosett Dr
- 6 Jacob Dr
- 296 Hemlock St