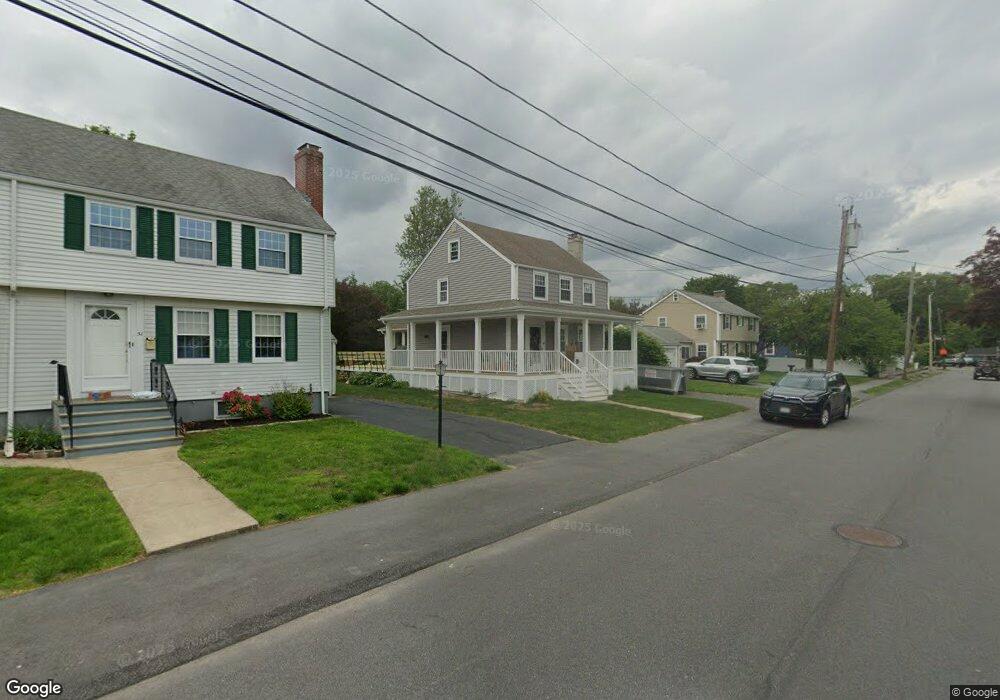
27 Beech St Dedham, MA 02026
The Manor NeighborhoodEstimated Value: $668,681 - $704,000
3
Beds
2
Baths
1,176
Sq Ft
$583/Sq Ft
Est. Value
About This Home
This home is located at 27 Beech St, Dedham, MA 02026 and is currently estimated at $685,920, approximately $583 per square foot. 27 Beech St is a home located in Norfolk County with nearby schools including Greenlodge Elementary School, Dedham Middle School, and Dedham High School.
Ownership History
Date
Name
Owned For
Owner Type
Purchase Details
Closed on
Sep 17, 2018
Sold by
Mcdonnell Michael J and Mcdonnell Judith A
Bought by
Shea Brendan T and Fenton Brittany M
Current Estimated Value
Home Financials for this Owner
Home Financials are based on the most recent Mortgage that was taken out on this home.
Original Mortgage
$386,000
Outstanding Balance
$336,646
Interest Rate
4.6%
Mortgage Type
New Conventional
Estimated Equity
$349,274
Purchase Details
Closed on
Oct 1, 1986
Bought by
Mcdonnell Michael J and Mcdonnell Judith A
Create a Home Valuation Report for This Property
The Home Valuation Report is an in-depth analysis detailing your home's value as well as a comparison with similar homes in the area
Home Values in the Area
Average Home Value in this Area
Purchase History
| Date | Buyer | Sale Price | Title Company |
|---|---|---|---|
| Shea Brendan T | $482,500 | -- | |
| Mcdonnell Michael J | $165,000 | -- |
Source: Public Records
Mortgage History
| Date | Status | Borrower | Loan Amount |
|---|---|---|---|
| Open | Shea Brendan T | $386,000 | |
| Previous Owner | Mcdonnell Michael J | $100,000 |
Source: Public Records
Tax History
| Year | Tax Paid | Tax Assessment Tax Assessment Total Assessment is a certain percentage of the fair market value that is determined by local assessors to be the total taxable value of land and additions on the property. | Land | Improvement |
|---|---|---|---|---|
| 2025 | $7,586 | $601,100 | $315,600 | $285,500 |
| 2024 | $7,250 | $580,000 | $286,300 | $293,700 |
| 2023 | $6,579 | $512,400 | $259,200 | $253,200 |
| 2022 | $6,202 | $464,600 | $243,500 | $221,100 |
| 2021 | $5,767 | $421,900 | $225,400 | $196,500 |
| 2020 | $5,967 | $434,900 | $225,400 | $209,500 |
| 2019 | $5,543 | $391,700 | $196,000 | $195,700 |
| 2018 | $5,379 | $369,700 | $174,000 | $195,700 |
| 2017 | $5,132 | $347,700 | $163,100 | $184,600 |
| 2016 | $5,265 | $339,900 | $151,000 | $188,900 |
| 2015 | $4,966 | $312,900 | $143,000 | $169,900 |
| 2014 | $4,838 | $300,900 | $140,400 | $160,500 |
Source: Public Records
Map
Nearby Homes
Your Personal Tour Guide
Ask me questions while you tour the home.