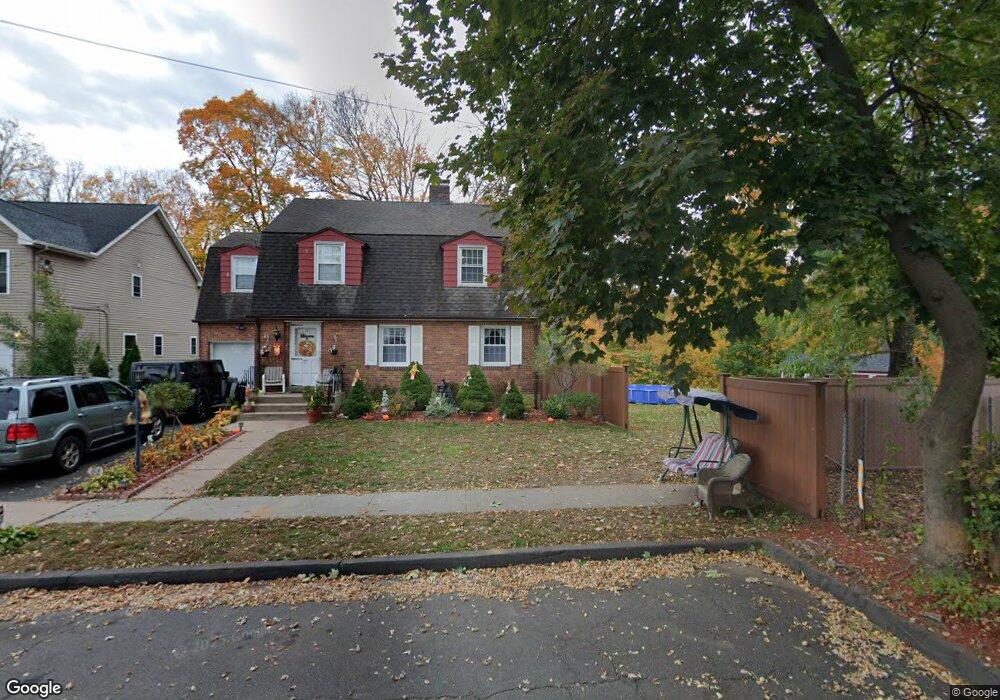
27 Bellew Rd East Hartford, CT 06108
Estimated Value: $340,465 - $349,000
4
Beds
2
Baths
2,000
Sq Ft
$172/Sq Ft
Est. Value
About This Home
This home is located at 27 Bellew Rd, East Hartford, CT 06108 and is currently estimated at $344,366, approximately $172 per square foot. 27 Bellew Rd is a home located in Hartford County with nearby schools including Dr. John A. Langford School, East Hartford Middle School, and East Hartford High School.
Ownership History
Date
Name
Owned For
Owner Type
Purchase Details
Closed on
Apr 22, 2008
Sold by
Est Mahon Ruth and Lacy Jane
Bought by
Morales Jose
Current Estimated Value
Home Financials for this Owner
Home Financials are based on the most recent Mortgage that was taken out on this home.
Original Mortgage
$209,879
Interest Rate
6.1%
Create a Home Valuation Report for This Property
The Home Valuation Report is an in-depth analysis detailing your home's value as well as a comparison with similar homes in the area
Home Values in the Area
Average Home Value in this Area
Purchase History
| Date | Buyer | Sale Price | Title Company |
|---|---|---|---|
| Morales Jose | $211,538 | -- |
Source: Public Records
Mortgage History
| Date | Status | Borrower | Loan Amount |
|---|---|---|---|
| Open | Morales Jose | $200,173 | |
| Closed | Morales Jose | $208,633 | |
| Closed | Morales Jose | $209,879 |
Source: Public Records
Tax History Compared to Growth
Tax History
| Year | Tax Paid | Tax Assessment Tax Assessment Total Assessment is a certain percentage of the fair market value that is determined by local assessors to be the total taxable value of land and additions on the property. | Land | Improvement |
|---|---|---|---|---|
| 2025 | $7,256 | $158,090 | $40,690 | $117,400 |
| 2024 | $6,956 | $158,090 | $40,690 | $117,400 |
| 2023 | $6,725 | $158,090 | $40,690 | $117,400 |
| 2022 | $6,482 | $158,090 | $40,690 | $117,400 |
| 2021 | $6,215 | $125,930 | $30,830 | $95,100 |
| 2020 | $6,286 | $125,930 | $30,830 | $95,100 |
| 2019 | $6,184 | $125,930 | $30,830 | $95,100 |
| 2018 | $6,002 | $125,930 | $30,830 | $95,100 |
| 2017 | $5,925 | $125,930 | $30,830 | $95,100 |
| 2016 | $5,636 | $122,900 | $28,290 | $94,610 |
| 2015 | $5,636 | $122,900 | $28,290 | $94,610 |
| 2014 | $5,580 | $122,900 | $28,290 | $94,610 |
Source: Public Records
Map
Nearby Homes
- 509 Burnside Ave Unit A18
- 506 Burnside Ave
- 421 Tolland St
- 421 Tolland St Unit 209
- 453 Burnside Ave
- 51 Daniel St
- 15 Michael Ave
- 89 Henderson Dr
- 30 Oakwood St
- 22 Matthew Rd
- 265 Burnside Ave
- 59 Laraia Ave
- 40 Larrabee St
- 67 Laurel St
- 10 Kenyon Place
- 73 Bliss St
- 181 Burnside Ave
- 8 Howard Ct Unit 10
- 85R Olmsted St
- 29 Joanne Dr Unit 29