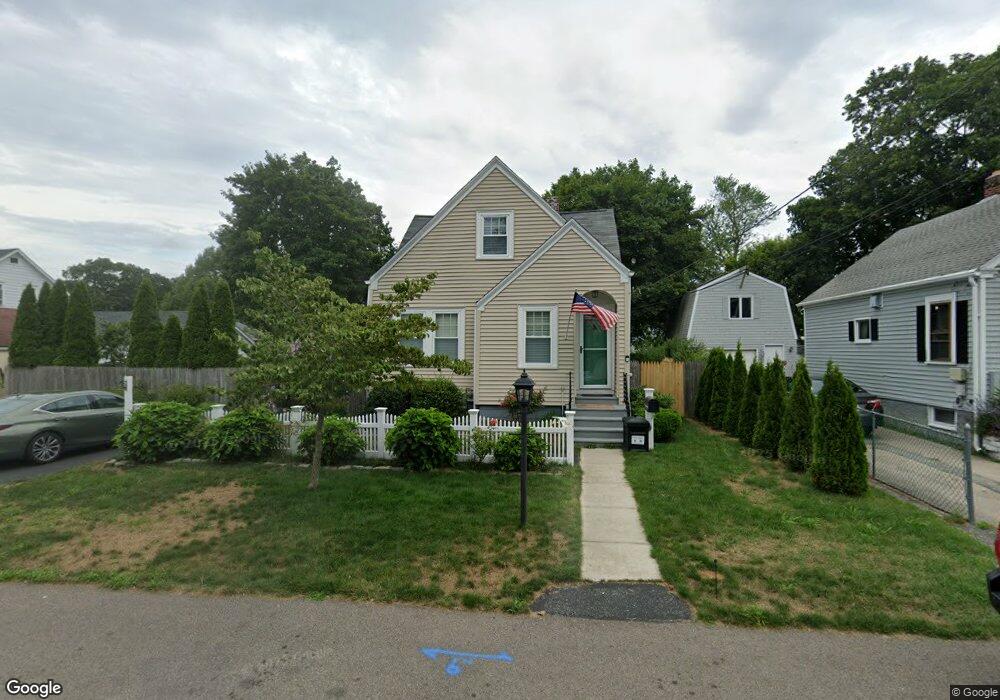
27 Belt St Warwick, RI 02889
Long Meadow NeighborhoodEstimated Value: $314,696 - $374,000
2
Beds
1
Bath
1,009
Sq Ft
$344/Sq Ft
Est. Value
About This Home
This home is located at 27 Belt St, Warwick, RI 02889 and is currently estimated at $347,424, approximately $344 per square foot. 27 Belt St is a home located in Kent County with nearby schools including Saint Kevin School and Bishop Hendricken High School.
Ownership History
Date
Name
Owned For
Owner Type
Purchase Details
Closed on
Jun 9, 2004
Sold by
Haley Nancy L
Bought by
Ri Hsng Mtg Finance Co
Current Estimated Value
Purchase Details
Closed on
Dec 17, 2001
Sold by
Kenahan Bernard G
Bought by
Haley Nancy L
Home Financials for this Owner
Home Financials are based on the most recent Mortgage that was taken out on this home.
Original Mortgage
$92,900
Interest Rate
6.6%
Mortgage Type
Purchase Money Mortgage
Create a Home Valuation Report for This Property
The Home Valuation Report is an in-depth analysis detailing your home's value as well as a comparison with similar homes in the area
Home Values in the Area
Average Home Value in this Area
Purchase History
| Date | Buyer | Sale Price | Title Company |
|---|---|---|---|
| Ri Hsng Mtg Finance Co | $175,000 | -- | |
| Haley Nancy L | $98,000 | -- |
Source: Public Records
Mortgage History
| Date | Status | Borrower | Loan Amount |
|---|---|---|---|
| Open | Haley Nancy L | $130,000 | |
| Previous Owner | Haley Nancy L | $127,000 | |
| Previous Owner | Haley Nancy L | $92,900 |
Source: Public Records
Tax History Compared to Growth
Tax History
| Year | Tax Paid | Tax Assessment Tax Assessment Total Assessment is a certain percentage of the fair market value that is determined by local assessors to be the total taxable value of land and additions on the property. | Land | Improvement |
|---|---|---|---|---|
| 2025 | $3,539 | $278,700 | $107,900 | $170,800 |
| 2024 | $3,460 | $239,100 | $90,200 | $148,900 |
| 2023 | $3,393 | $239,100 | $90,200 | $148,900 |
| 2022 | $3,188 | $170,200 | $56,800 | $113,400 |
| 2021 | $3,188 | $170,200 | $56,800 | $113,400 |
| 2020 | $3,188 | $170,200 | $56,800 | $113,400 |
| 2019 | $3,188 | $170,200 | $56,800 | $113,400 |
| 2018 | $2,737 | $131,600 | $54,600 | $77,000 |
| 2017 | $2,664 | $131,600 | $54,600 | $77,000 |
| 2016 | $2,664 | $131,600 | $54,600 | $77,000 |
| 2015 | $2,241 | $108,000 | $49,400 | $58,600 |
| 2014 | $2,166 | $108,000 | $49,400 | $58,600 |
| 2013 | $2,137 | $108,000 | $49,400 | $58,600 |
Source: Public Records
Map
Nearby Homes