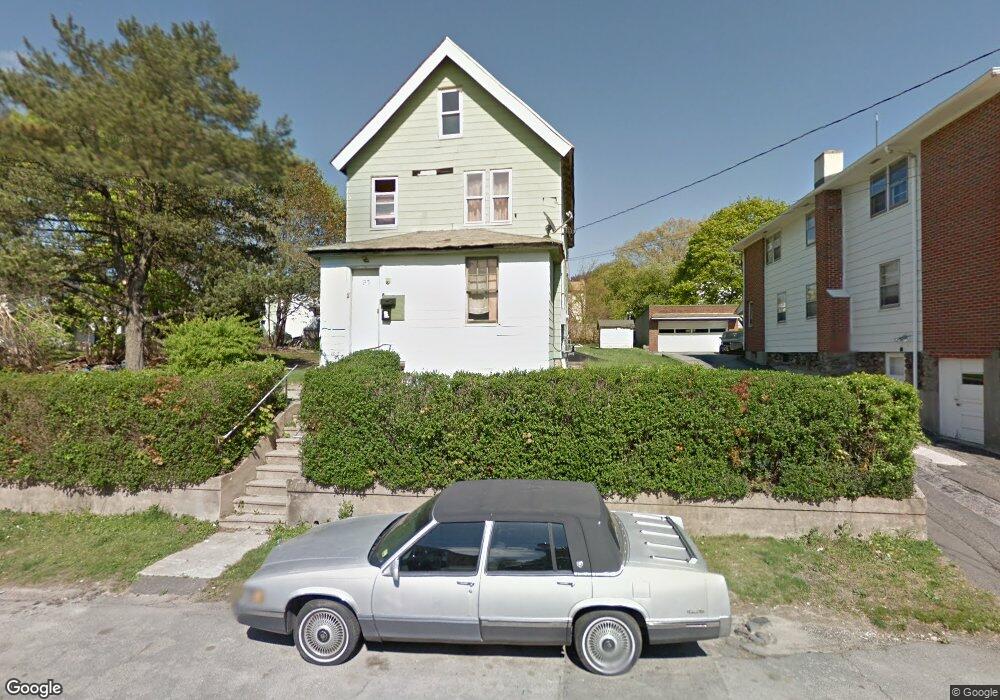
27 Birch St Waterbury, CT 06704
North End District NeighborhoodEstimated Value: $211,065 - $330,000
4
Beds
2
Baths
1,520
Sq Ft
$168/Sq Ft
Est. Value
About This Home
This home is located at 27 Birch St, Waterbury, CT 06704 and is currently estimated at $255,516, approximately $168 per square foot. 27 Birch St is a home located in New Haven County with nearby schools including Woodrow Wilson School, Michael F. Wallace Middle School, and Crosby High School.
Ownership History
Date
Name
Owned For
Owner Type
Purchase Details
Closed on
Sep 5, 2023
Sold by
Cavallo Michael
Bought by
Valentin Arnaldo
Current Estimated Value
Home Financials for this Owner
Home Financials are based on the most recent Mortgage that was taken out on this home.
Original Mortgage
$100,000
Outstanding Balance
$97,819
Interest Rate
6.81%
Mortgage Type
Purchase Money Mortgage
Estimated Equity
$157,697
Create a Home Valuation Report for This Property
The Home Valuation Report is an in-depth analysis detailing your home's value as well as a comparison with similar homes in the area
Home Values in the Area
Average Home Value in this Area
Purchase History
| Date | Buyer | Sale Price | Title Company |
|---|---|---|---|
| Valentin Arnaldo | $100,000 | None Available |
Source: Public Records
Mortgage History
| Date | Status | Borrower | Loan Amount |
|---|---|---|---|
| Open | Valentin Arnaldo | $100,000 |
Source: Public Records
Tax History
| Year | Tax Paid | Tax Assessment Tax Assessment Total Assessment is a certain percentage of the fair market value that is determined by local assessors to be the total taxable value of land and additions on the property. | Land | Improvement |
|---|---|---|---|---|
| 2025 | $4,701 | $104,510 | $13,790 | $90,720 |
| 2024 | $5,167 | $104,510 | $13,790 | $90,720 |
| 2023 | $5,663 | $104,510 | $13,790 | $90,720 |
| 2022 | $2,574 | $42,750 | $13,820 | $28,930 |
| 2021 | $2,574 | $42,750 | $13,820 | $28,930 |
| 2020 | $2,574 | $42,750 | $13,820 | $28,930 |
| 2019 | $2,574 | $42,750 | $13,820 | $28,930 |
| 2018 | $2,574 | $42,750 | $13,820 | $28,930 |
| 2017 | $2,599 | $43,170 | $13,810 | $29,360 |
| 2016 | $2,599 | $43,170 | $13,810 | $29,360 |
| 2015 | $2,513 | $43,170 | $13,810 | $29,360 |
| 2014 | $2,513 | $43,170 | $13,810 | $29,360 |
Source: Public Records
Map
Nearby Homes
Your Personal Tour Guide
Ask me questions while you tour the home.