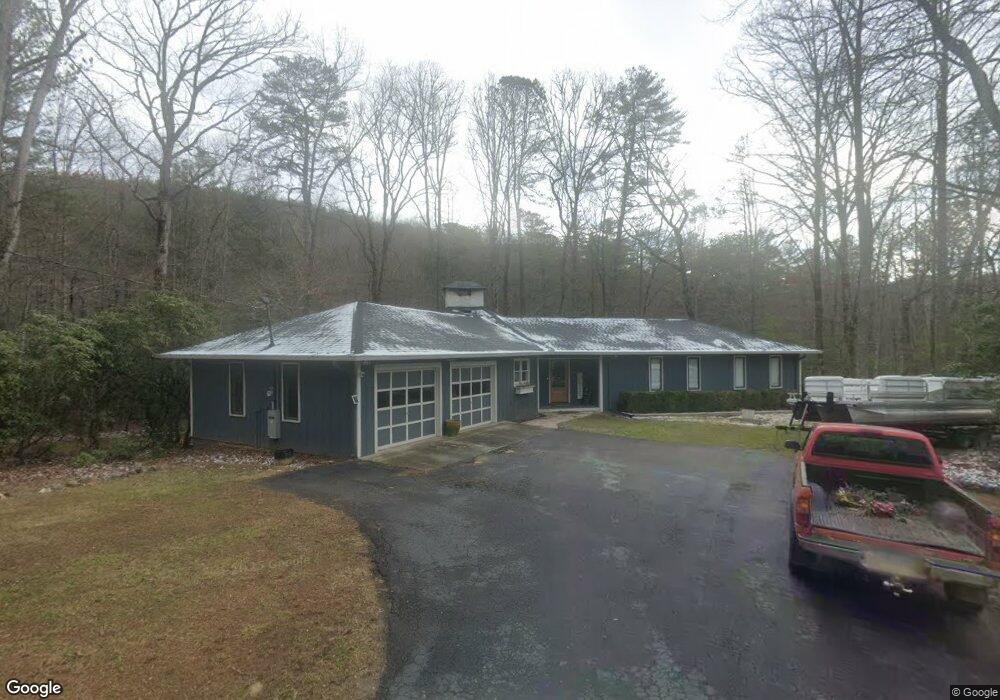
27 Blalock Goldmine Rd Unit 9 Clayton, GA 30525
Estimated Value: $579,947 - $967,000
3
Beds
2
Baths
1,740
Sq Ft
$424/Sq Ft
Est. Value
About This Home
This home is located at 27 Blalock Goldmine Rd Unit 9, Clayton, GA 30525 and is currently estimated at $737,237, approximately $423 per square foot. 27 Blalock Goldmine Rd Unit 9 is a home located in Rabun County with nearby schools including Rabun County Primary School and Rabun County High School.
Ownership History
Date
Name
Owned For
Owner Type
Purchase Details
Closed on
Jul 29, 2024
Sold by
Waters Carey L
Bought by
Jdw Living Trust
Current Estimated Value
Purchase Details
Closed on
Jul 21, 2023
Sold by
Borck Kimberly Y
Bought by
Waters Carey and Waters Julie
Purchase Details
Closed on
Sep 24, 2018
Sold by
Galloway John F
Bought by
Borck Richard D and Borck Kimberly Y
Home Financials for this Owner
Home Financials are based on the most recent Mortgage that was taken out on this home.
Original Mortgage
$156,000
Interest Rate
4.75%
Mortgage Type
New Conventional
Purchase Details
Closed on
Feb 22, 2005
Sold by
Guthrie Jack Douglas
Bought by
Galloway John F and Galloway Barbara W
Home Financials for this Owner
Home Financials are based on the most recent Mortgage that was taken out on this home.
Original Mortgage
$219,200
Interest Rate
5.6%
Mortgage Type
New Conventional
Create a Home Valuation Report for This Property
The Home Valuation Report is an in-depth analysis detailing your home's value as well as a comparison with similar homes in the area
Home Values in the Area
Average Home Value in this Area
Purchase History
| Date | Buyer | Sale Price | Title Company |
|---|---|---|---|
| Jdw Living Trust | -- | -- | |
| Waters Carey | $490,000 | -- | |
| Borck Richard D | $195,000 | -- | |
| Borck Richard D | $195,000 | -- | |
| Galloway John F | $274,000 | -- | |
| Galloway John F | $274,000 | -- |
Source: Public Records
Mortgage History
| Date | Status | Borrower | Loan Amount |
|---|---|---|---|
| Previous Owner | Borck Richard D | $156,000 | |
| Previous Owner | Galloway John F | $219,200 |
Source: Public Records
Tax History Compared to Growth
Tax History
| Year | Tax Paid | Tax Assessment Tax Assessment Total Assessment is a certain percentage of the fair market value that is determined by local assessors to be the total taxable value of land and additions on the property. | Land | Improvement |
|---|---|---|---|---|
| 2025 | $2,747 | $171,177 | $20,494 | $150,683 |
| 2024 | $2,617 | $163,043 | $20,494 | $142,549 |
| 2023 | $1,591 | $86,913 | $17,682 | $69,231 |
| 2022 | $1,617 | $88,362 | $21,472 | $66,890 |
| 2021 | $1,491 | $79,511 | $20,040 | $59,471 |
| 2020 | $1,421 | $73,279 | $20,040 | $53,239 |
| 2019 | $1,431 | $73,279 | $20,040 | $53,239 |
| 2018 | $1,383 | $70,568 | $20,040 | $50,528 |
| 2017 | $1,327 | $70,568 | $20,040 | $50,528 |
| 2016 | $1,330 | $70,568 | $20,040 | $50,528 |
| 2015 | $1,308 | $67,924 | $20,040 | $47,884 |
| 2014 | $1,315 | $67,924 | $20,040 | $47,884 |
Source: Public Records
Map
Nearby Homes
- 0 Hwy 197 Unit 10608906
- 0 Crows Nest Dr
- 234 Raindance Ln
- 207 Raindance Ln
- 876 Whitetail Trail
- 177 Whitetail Trail
- 171 High Pointe Dr
- 655 Bent Grass Way
- A19 Winterberry Dr
- 123 Village Club Trail
- LOT44 Bent Grass Way
- 263 Seabrook Ln
- L-3 High Pointe Dr Unit L-3
- 235 Grey Fox Trail
- LOT 12A Winterberry Trail
- A 7 Winterberry Trail
- LOT C2 Grey Fox Trail
- LOT C1 Grey Fox Trail
- 0 Waterfall Dr Unit LOT G1 10436783
- J35 Bent Grass Way
- 27 Blalock Goldmine Rd
- 1 Blalock Goldmine Rd Unit 1
- 0 Hwy 197 Unit 7 8231696
- 0 Hwy 197 Unit 8231695
- 0 Hwy 197 Unit 3136600
- 0 Hwy 197 Unit 7029683
- 456 Highway 197
- 256 Main Mast Dr
- 275 Blalock Goldmine Rd Unit Tract 2
- 275 Blalock Goldmine Rd
- 568 Georgia 197
- 197 Highway 197
- 568 Highway 197
- 568 Highway 197
- 568 Highway 197
- 568 Highway 197
- 568 Highway 197
- 568 Highway 197
- 568 Highway 197
- 568 Highway 197