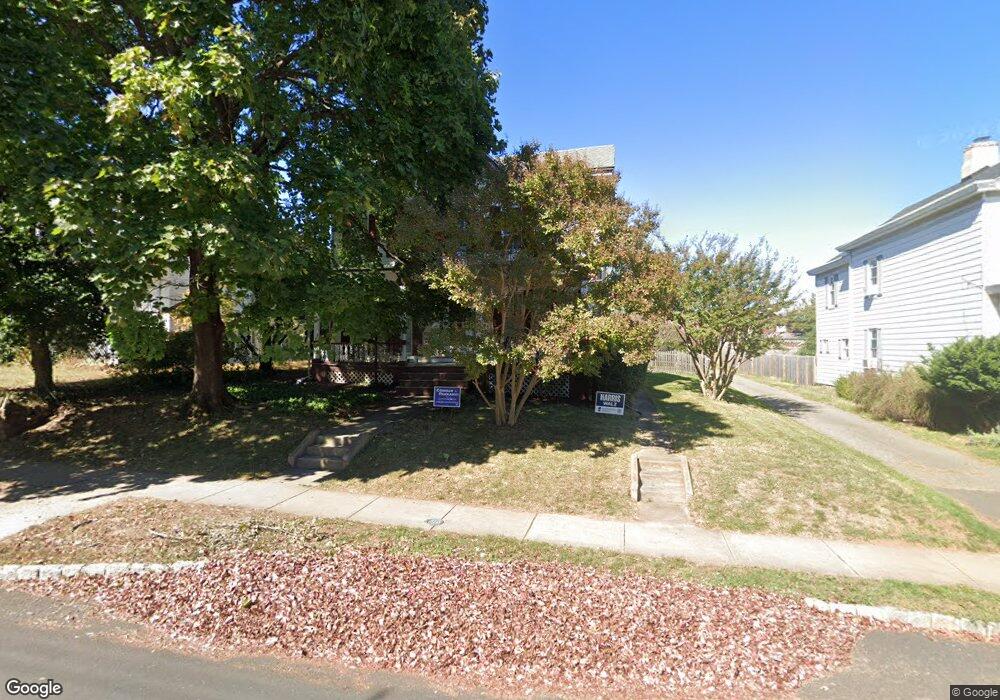
27 Bonnell St Flemington, NJ 08822
Estimated Value: $574,628 - $677,000
--
Bed
--
Bath
2,248
Sq Ft
$281/Sq Ft
Est. Value
About This Home
This home is located at 27 Bonnell St, Flemington, NJ 08822 and is currently estimated at $632,407, approximately $281 per square foot. 27 Bonnell St is a home located in Hunterdon County with nearby schools including Robert Hunter Elementary School, Reading Fleming Intermediate School, and J.P. Case Middle School.
Ownership History
Date
Name
Owned For
Owner Type
Purchase Details
Closed on
Jun 27, 1997
Sold by
D'Alessio Theodore F
Bought by
Gunnet Joseph W and Gunnet Elizabeth M
Current Estimated Value
Home Financials for this Owner
Home Financials are based on the most recent Mortgage that was taken out on this home.
Original Mortgage
$180,000
Outstanding Balance
$26,621
Interest Rate
7.86%
Estimated Equity
$605,786
Purchase Details
Closed on
Aug 31, 1989
Sold by
Bender James G and Bender Emma C
Bought by
Dalessio Theodore F and Dalessio Janet E
Create a Home Valuation Report for This Property
The Home Valuation Report is an in-depth analysis detailing your home's value as well as a comparison with similar homes in the area
Home Values in the Area
Average Home Value in this Area
Purchase History
| Date | Buyer | Sale Price | Title Company |
|---|---|---|---|
| Gunnet Joseph W | $225,000 | -- | |
| Dalessio Theodore F | $212,000 | -- |
Source: Public Records
Mortgage History
| Date | Status | Borrower | Loan Amount |
|---|---|---|---|
| Open | Gunnet Joseph W | $180,000 |
Source: Public Records
Tax History Compared to Growth
Tax History
| Year | Tax Paid | Tax Assessment Tax Assessment Total Assessment is a certain percentage of the fair market value that is determined by local assessors to be the total taxable value of land and additions on the property. | Land | Improvement |
|---|---|---|---|---|
| 2025 | $12,354 | $470,100 | $147,800 | $322,300 |
| 2024 | $11,928 | $438,700 | $136,800 | $301,900 |
| 2023 | $11,928 | $411,300 | $127,800 | $283,500 |
| 2022 | $11,808 | $391,900 | $120,600 | $271,300 |
| 2021 | $11,327 | $374,900 | $113,800 | $261,100 |
| 2020 | $11,686 | $367,700 | $112,700 | $255,000 |
| 2019 | $11,327 | $364,200 | $111,300 | $252,900 |
| 2018 | $11,050 | $361,000 | $110,200 | $250,800 |
| 2017 | $10,887 | $352,800 | $110,200 | $242,600 |
| 2016 | $10,817 | $344,500 | $108,000 | $236,500 |
| 2015 | $10,335 | $338,400 | $108,000 | $230,400 |
| 2014 | $9,545 | $321,500 | $107,000 | $214,500 |
Source: Public Records
Map
Nearby Homes
- 61 Park Ave
- 30 Capner St
- 5 William Martin Way Unit 5
- 53A Broad St
- 22 Allen St
- 12 Corcoran St
- 41 Shields Ave
- 92 Park Ave
- 100 State Route 12
- 402 Clark Cir
- 56 Pennsylvania Ave
- 613 Village Commons
- 198 U S Highway 202
- 410 Village Commons
- 14 Dayton Rd
- 3 Pony Ln
- 4 Furman Ln
- 5 Stable Ln
- 8 Grandin Dr
- 10 Grandin Dr