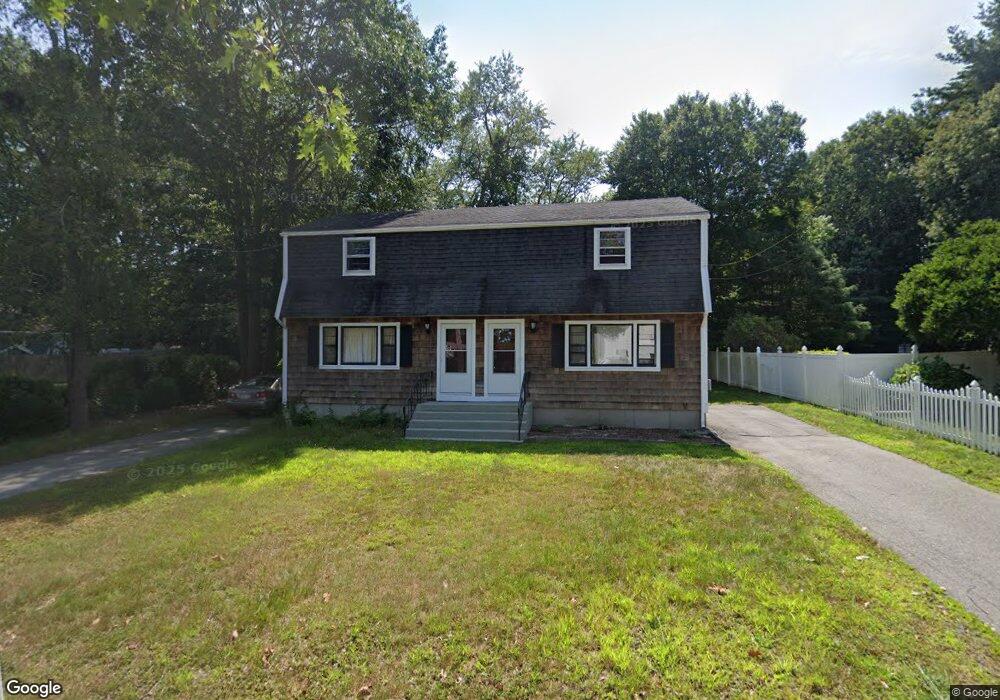
27 Border Rd Unit 29 Holbrook, MA 02343
Estimated Value: $649,000 - $688,000
4
Beds
2
Baths
1,920
Sq Ft
$344/Sq Ft
Est. Value
About This Home
This home is located at 27 Border Rd Unit 29, Holbrook, MA 02343 and is currently estimated at $661,177, approximately $344 per square foot. 27 Border Rd Unit 29 is a home located in Norfolk County with nearby schools including John F. Kennedy Elementary School, Holbrook Middle High School, and Boston Higashi School.
Ownership History
Date
Name
Owned For
Owner Type
Purchase Details
Closed on
Nov 25, 2021
Sold by
Hammond Kathleen M
Bought by
Hammond Ft and Hammond
Current Estimated Value
Purchase Details
Closed on
Aug 4, 1972
Bought by
Hammond Neil H and Hammond Kathleen M
Create a Home Valuation Report for This Property
The Home Valuation Report is an in-depth analysis detailing your home's value as well as a comparison with similar homes in the area
Home Values in the Area
Average Home Value in this Area
Purchase History
| Date | Buyer | Sale Price | Title Company |
|---|---|---|---|
| Hammond Ft | -- | None Available | |
| Hammond Ft | -- | None Available | |
| Hammond Ft | -- | None Available | |
| Hammond Neil H | -- | -- |
Source: Public Records
Tax History
| Year | Tax Paid | Tax Assessment Tax Assessment Total Assessment is a certain percentage of the fair market value that is determined by local assessors to be the total taxable value of land and additions on the property. | Land | Improvement |
|---|---|---|---|---|
| 2025 | $80 | $605,600 | $249,500 | $356,100 |
| 2024 | $7,924 | $589,600 | $249,100 | $340,500 |
| 2023 | $8,514 | $553,600 | $226,600 | $327,000 |
| 2022 | $7,284 | $441,700 | $206,100 | $235,600 |
| 2021 | $6,662 | $386,900 | $187,100 | $199,800 |
| 2020 | $6,914 | $376,400 | $181,500 | $194,900 |
| 2019 | $6,875 | $353,300 | $170,000 | $183,300 |
| 2018 | $6,912 | $334,400 | $157,500 | $176,900 |
| 2017 | $6,416 | $307,000 | $143,100 | $163,900 |
| 2016 | $5,959 | $303,400 | $139,500 | $163,900 |
| 2015 | $5,613 | $294,200 | $133,500 | $160,700 |
| 2014 | $5,612 | $299,000 | $133,500 | $165,500 |
Source: Public Records
Map
Nearby Homes
- 27 Valley Rd
- 19 Overlook Rd
- 14 Washington Cir
- 14 Leonard Ln
- 68 Spring St
- 375 S Franklin St Unit 1
- 660 S Franklin St
- 0 Payson Ave
- 7 Oakwood Ave
- 24 Reeds Ln
- 52 Quincy St
- 37 Reeds Ln
- 719 S Franklin St Unit C Block 1
- 95 Rindone St
- 68 Robbins St
- 181 S Franklin St Unit 102
- 181 S Franklin St Unit 206
- 152 S Franklin St
- 276 Center St
- 12 Hamilton Way
Your Personal Tour Guide
Ask me questions while you tour the home.