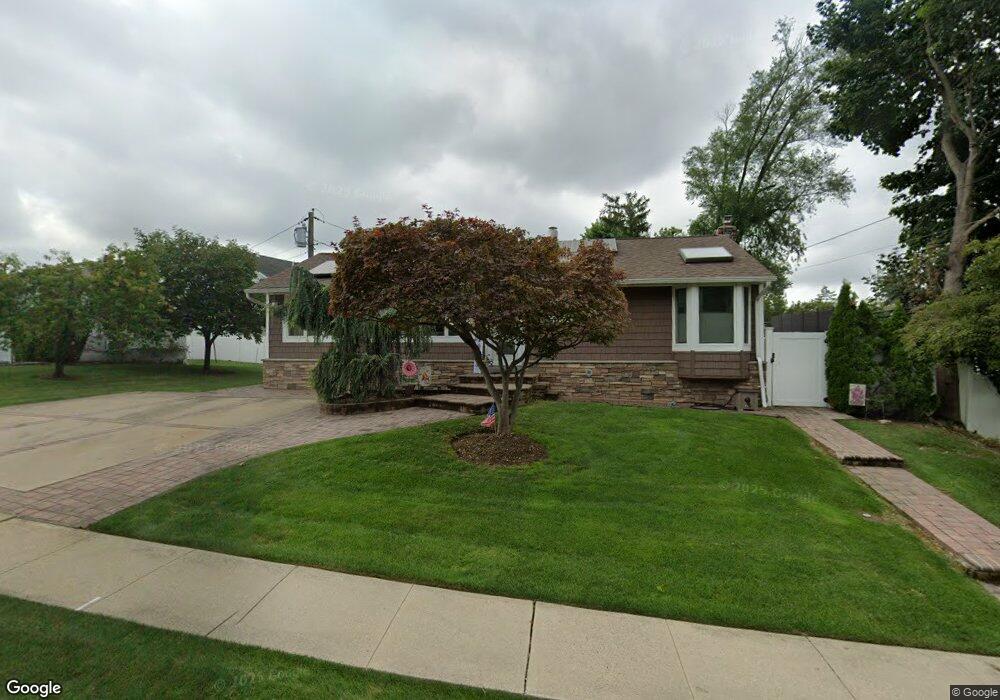
27 Brixton Rd Old Bethpage, NY 11804
Estimated Value: $787,026 - $930,000
Studio
2
Baths
1,142
Sq Ft
$752/Sq Ft
Est. Value
About This Home
This home is located at 27 Brixton Rd, Old Bethpage, NY 11804 and is currently estimated at $858,513, approximately $751 per square foot. 27 Brixton Rd is a home located in Nassau County with nearby schools including Old Bethpage School, Plainview Old Bethpage Middle School, and Plainview-Old Bethpage John F. Kennedy High School.
Ownership History
Date
Name
Owned For
Owner Type
Purchase Details
Closed on
Jun 25, 2017
Sold by
Day Derek and Pepitone Concetta
Bought by
Day Derek and Pepitone Concetta
Current Estimated Value
Purchase Details
Closed on
Aug 4, 2005
Sold by
Castrova Harold
Bought by
Day Derek
Create a Home Valuation Report for This Property
The Home Valuation Report is an in-depth analysis detailing your home's value as well as a comparison with similar homes in the area
Home Values in the Area
Average Home Value in this Area
Purchase History
| Date | Buyer | Sale Price | Title Company |
|---|---|---|---|
| Day Derek | -- | -- | |
| Day Derek | $540,000 | -- |
Source: Public Records
Tax History
| Year | Tax Paid | Tax Assessment Tax Assessment Total Assessment is a certain percentage of the fair market value that is determined by local assessors to be the total taxable value of land and additions on the property. | Land | Improvement |
|---|---|---|---|---|
| 2025 | $13,785 | $498 | $258 | $240 |
| 2024 | $4,177 | $507 | $262 | $245 |
Source: Public Records
Map
Nearby Homes
- 31 Seton Ct
- 14 John Dr
- 31 Prescott Place
- 2 Lee Place
- 6 Lee Place
- 7 Sheridan St
- 34 Gloria Place
- 20 Briarwood Ln
- 78 Santa Barbara Dr
- 14 Woodland Dr
- 128 Santa Barbara Dr
- 17 Dover Ln
- 42 Briarwood Ln
- 93 Palo Alto Dr
- 37 Santa Barbara Dr
- 21105 Aspenwood Dr
- 152 Haypath Rd
- 600 Plainview Rd
- 4 Cranford Rd
- 61 Stephen Dr
Your Personal Tour Guide
Ask me questions while you tour the home.