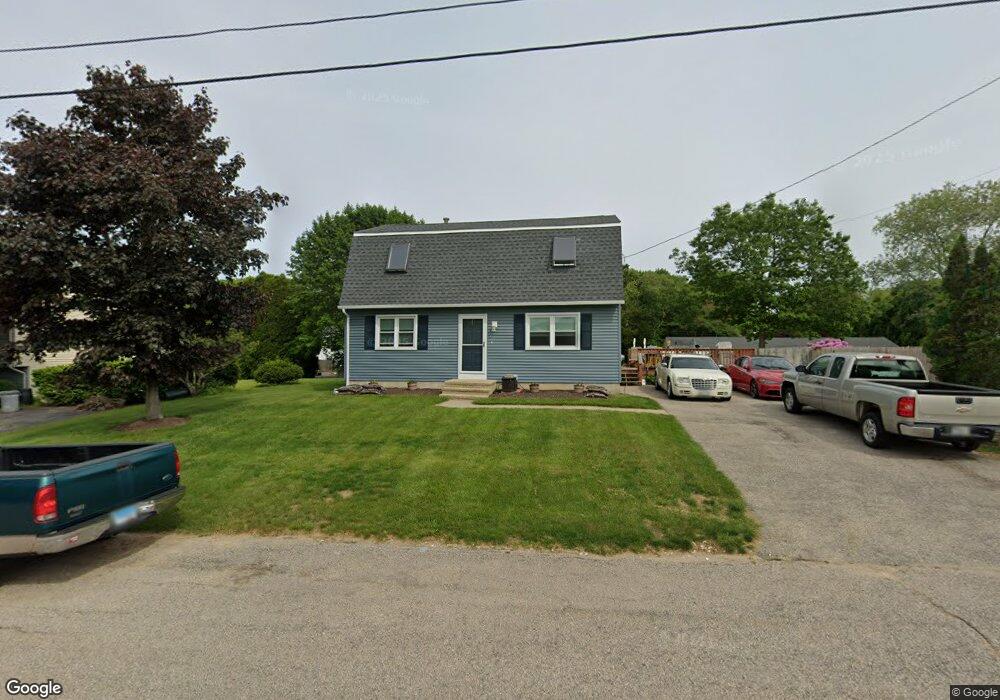
27 Byron Dr Westerly, RI 02891
Estimated Value: $765,000 - $813,000
3
Beds
2
Baths
1,680
Sq Ft
$469/Sq Ft
Est. Value
About This Home
This home is located at 27 Byron Dr, Westerly, RI 02891 and is currently estimated at $787,935, approximately $469 per square foot. 27 Byron Dr is a home located in Washington County with nearby schools including Westerly High School, North Stonington Christian Academy, and St. Michael School.
Ownership History
Date
Name
Owned For
Owner Type
Purchase Details
Closed on
Mar 5, 2024
Sold by
Blasdell Gregory A
Bought by
E H M Snyder Irt and Snyder
Current Estimated Value
Purchase Details
Closed on
May 30, 2014
Sold by
Hamel Lutz and Frio-Hamel Natalie
Bought by
Blasdell Gregory A
Home Financials for this Owner
Home Financials are based on the most recent Mortgage that was taken out on this home.
Original Mortgage
$250,000
Interest Rate
4.26%
Mortgage Type
New Conventional
Purchase Details
Closed on
Oct 15, 1999
Sold by
Judge Robert A and Judge Janice B
Bought by
Hamel Lutz and Hamel Natalie Frio
Home Financials for this Owner
Home Financials are based on the most recent Mortgage that was taken out on this home.
Original Mortgage
$204,000
Interest Rate
7.8%
Mortgage Type
Purchase Money Mortgage
Create a Home Valuation Report for This Property
The Home Valuation Report is an in-depth analysis detailing your home's value as well as a comparison with similar homes in the area
Home Values in the Area
Average Home Value in this Area
Purchase History
| Date | Buyer | Sale Price | Title Company |
|---|---|---|---|
| E H M Snyder Irt | $700,000 | None Available | |
| Blasdell Gregory A | $340,000 | -- | |
| Hamel Lutz | $255,000 | -- |
Source: Public Records
Mortgage History
| Date | Status | Borrower | Loan Amount |
|---|---|---|---|
| Previous Owner | Hamel Lutz | $250,000 | |
| Previous Owner | Hamel Lutz | $175,000 | |
| Previous Owner | Hamel Lutz | $204,000 |
Source: Public Records
Tax History
| Year | Tax Paid | Tax Assessment Tax Assessment Total Assessment is a certain percentage of the fair market value that is determined by local assessors to be the total taxable value of land and additions on the property. | Land | Improvement |
|---|---|---|---|---|
| 2025 | $5,679 | $635,200 | $234,600 | $400,600 |
| 2024 | $5,610 | $507,700 | $184,500 | $323,200 |
| 2023 | $5,547 | $502,000 | $184,500 | $317,500 |
| 2022 | $5,497 | $502,000 | $184,500 | $317,500 |
| 2021 | $5,828 | $403,300 | $162,700 | $240,600 |
| 2020 | $5,828 | $403,300 | $162,700 | $240,600 |
| 2019 | $5,828 | $403,300 | $162,700 | $240,600 |
| 2018 | $5,474 | $349,100 | $151,400 | $197,700 |
| 2017 | $5,345 | $349,100 | $151,400 | $197,700 |
| 2016 | $5,268 | $349,100 | $151,400 | $197,700 |
Source: Public Records
Map
Nearby Homes
Your Personal Tour Guide
Ask me questions while you tour the home.