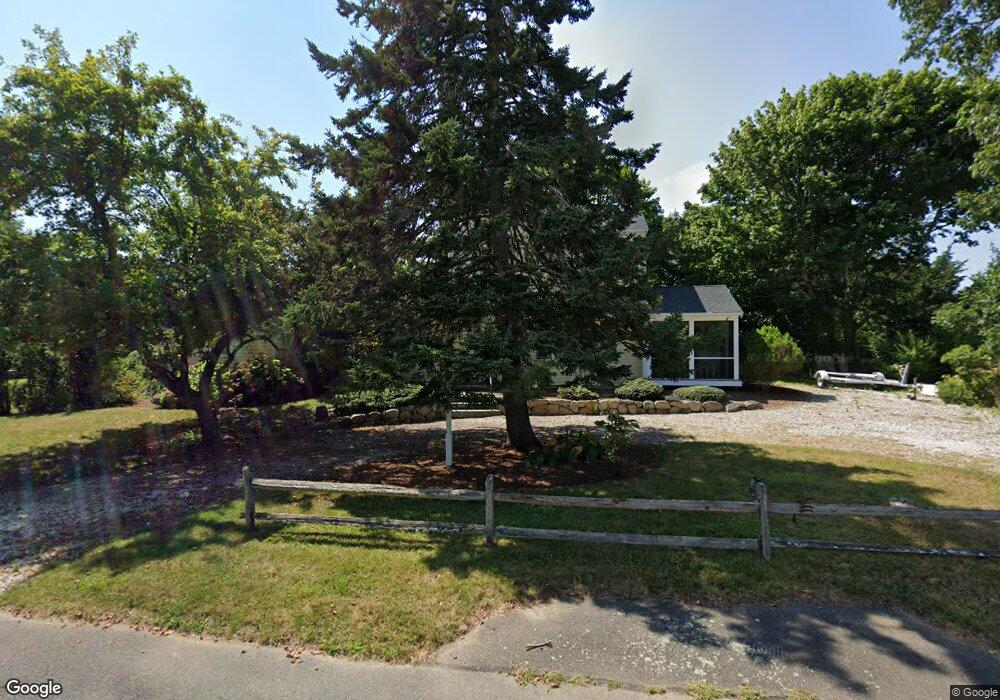
27 Capri Ln Chatham, MA 02633
Chatham Village NeighborhoodEstimated Value: $2,170,000 - $2,608,000
4
Beds
4
Baths
2,109
Sq Ft
$1,119/Sq Ft
Est. Value
About This Home
This home is located at 27 Capri Ln, Chatham, MA 02633 and is currently estimated at $2,359,534, approximately $1,118 per square foot. 27 Capri Ln is a home located in Barnstable County with nearby schools including Chatham Elementary School, Harwich Elementary School, and Monomoy Regional Middle School.
Ownership History
Date
Name
Owned For
Owner Type
Purchase Details
Closed on
Nov 2, 1992
Sold by
Carey Mary Frances and Rafuse John L
Bought by
Treback Arnold S and Rosner Marjorie A
Current Estimated Value
Home Financials for this Owner
Home Financials are based on the most recent Mortgage that was taken out on this home.
Original Mortgage
$124,400
Interest Rate
7.85%
Mortgage Type
Purchase Money Mortgage
Create a Home Valuation Report for This Property
The Home Valuation Report is an in-depth analysis detailing your home's value as well as a comparison with similar homes in the area
Home Values in the Area
Average Home Value in this Area
Purchase History
| Date | Buyer | Sale Price | Title Company |
|---|---|---|---|
| Treback Arnold S | $155,500 | -- |
Source: Public Records
Mortgage History
| Date | Status | Borrower | Loan Amount |
|---|---|---|---|
| Closed | Treback Arnold S | $124,400 |
Source: Public Records
Tax History
| Year | Tax Paid | Tax Assessment Tax Assessment Total Assessment is a certain percentage of the fair market value that is determined by local assessors to be the total taxable value of land and additions on the property. | Land | Improvement |
|---|---|---|---|---|
| 2025 | $6,285 | $1,811,300 | $1,139,200 | $672,100 |
| 2024 | $6,103 | $1,709,400 | $1,074,700 | $634,700 |
| 2023 | $5,743 | $1,480,100 | $895,600 | $584,500 |
| 2022 | $5,271 | $1,140,900 | $895,600 | $245,300 |
| 2021 | $4,918 | $987,500 | $759,800 | $227,700 |
| 2020 | $4,462 | $925,800 | $694,600 | $231,200 |
| 2019 | $4,291 | $884,800 | $649,400 | $235,400 |
| 2018 | $4,223 | $867,200 | $649,400 | $217,800 |
| 2017 | $4,272 | $849,300 | $630,300 | $219,000 |
| 2016 | $4,217 | $840,100 | $618,100 | $222,000 |
| 2015 | $4,108 | $823,200 | $600,600 | $222,600 |
| 2014 | $4,183 | $823,500 | $600,600 | $222,900 |
Source: Public Records
Map
Nearby Homes
- 85 Cedar St
- 287 Cedar St
- 292 Stage Harbor Rd
- 8 Kingsbury Way
- 99 Uncle Alberts Drive Extension
- 121 Queen Anne Rd
- 55 Christopher Harding Ln
- 33 Crowell Rd
- 425 Main St Unit D
- 425 Main St Unit D
- 14 Pond View Ln
- 50 Eldredge Square S
- 246 Stage Island Rd
- 3 Oyster Dr
- 150 Main St
- 27 Martha Kendrick Dr
- 231 Crowell Rd
- 230 Barcliff Ave
- 20 Jessies Landing
- 66 Ethelma Dr
Your Personal Tour Guide
Ask me questions while you tour the home.