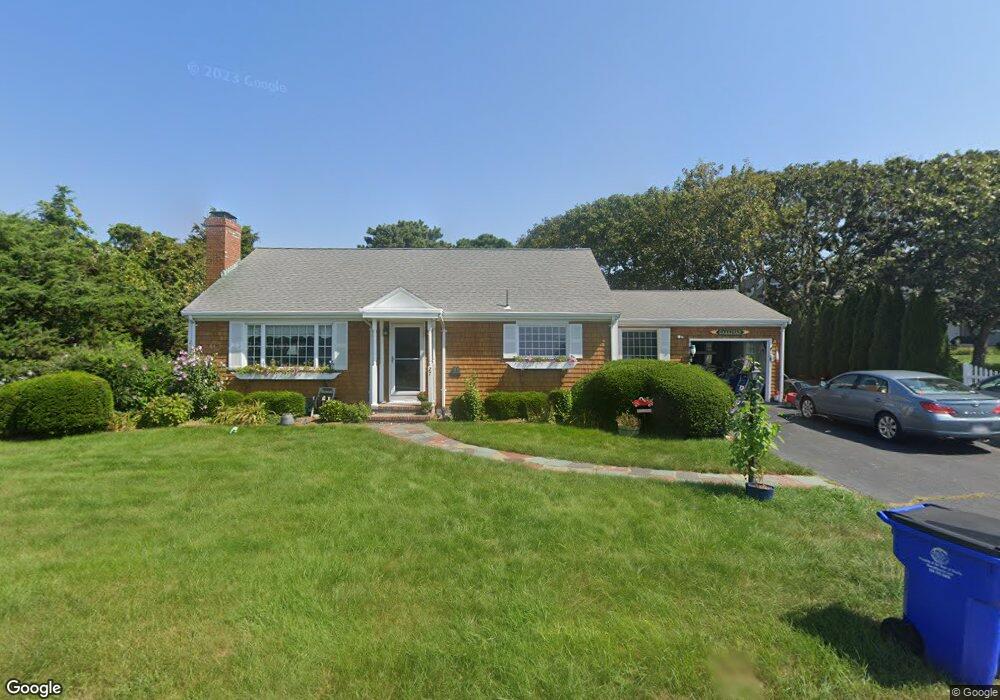
27 Captains Row Buzzards Bay, MA 02532
Estimated Value: $754,000 - $1,062,000
2
Beds
2
Baths
1,318
Sq Ft
$687/Sq Ft
Est. Value
About This Home
This home is located at 27 Captains Row, Buzzards Bay, MA 02532 and is currently estimated at $905,758, approximately $687 per square foot. 27 Captains Row is a home located in Barnstable County with nearby schools including Bourne High School.
Ownership History
Date
Name
Owned For
Owner Type
Purchase Details
Closed on
May 2, 1995
Sold by
Gallivan James J and Gallivan James J
Bought by
Shea-Gallivan Laurel and Gallivan Patricia A
Current Estimated Value
Home Financials for this Owner
Home Financials are based on the most recent Mortgage that was taken out on this home.
Original Mortgage
$100,000
Interest Rate
8.33%
Mortgage Type
Purchase Money Mortgage
Create a Home Valuation Report for This Property
The Home Valuation Report is an in-depth analysis detailing your home's value as well as a comparison with similar homes in the area
Purchase History
| Date | Buyer | Sale Price | Title Company |
|---|---|---|---|
| Shea-Gallivan Laurel | $150,000 | -- | |
| Shea-Gallivan Laurel | $150,000 | -- |
Source: Public Records
Mortgage History
| Date | Status | Borrower | Loan Amount |
|---|---|---|---|
| Open | Shea-Gallivan Laurel | $100,000 | |
| Closed | Shea-Gallivan Laurel | $50,000 | |
| Closed | Shea-Gallivan Laurel | $100,000 |
Source: Public Records
Tax History
| Year | Tax Paid | Tax Assessment Tax Assessment Total Assessment is a certain percentage of the fair market value that is determined by local assessors to be the total taxable value of land and additions on the property. | Land | Improvement |
|---|---|---|---|---|
| 2025 | $6,325 | $809,800 | $544,500 | $265,300 |
| 2024 | $6,183 | $771,000 | $518,500 | $252,500 |
| 2023 | $6,012 | $682,400 | $458,900 | $223,500 |
| 2022 | $5,888 | $583,500 | $406,100 | $177,400 |
| 2021 | $6,052 | $561,900 | $400,400 | $161,500 |
| 2020 | $5,910 | $550,300 | $396,600 | $153,700 |
| 2019 | $5,692 | $541,600 | $396,600 | $145,000 |
| 2018 | $5,363 | $508,800 | $377,700 | $131,100 |
| 2017 | $5,606 | $544,300 | $414,500 | $129,800 |
| 2016 | $5,269 | $518,600 | $414,400 | $104,200 |
| 2015 | $5,222 | $518,600 | $414,400 | $104,200 |
Source: Public Records
Map
Nearby Homes
- 248 Great Neck Rd
- 35 Benedict Rd
- 566 Shore Rd
- 14 Navajo Rd
- 200 Great Neck Rd
- 60 Bourne Neck Dr
- 36B Starboard Dr Unit 36E
- 36B Starboard Dr Unit 36G
- 36B Starboard Dr Unit 36C
- 36B Starboard Dr Unit 36A
- 36B Starboard Dr Unit 36D
- 36B Starboard Dr Unit 36B
- 36B Starboard Dr Unit 36F
- 36B Starboard Dr Unit 36H
- 3 Carleton St Unit 3
- 23 Starboard Dr Unit Lot 50
- 32 Carleton St Unit 32
- 8 Over Jordan Rd
- 10 East Blvd
- 10 East Blvd
Your Personal Tour Guide
Ask me questions while you tour the home.