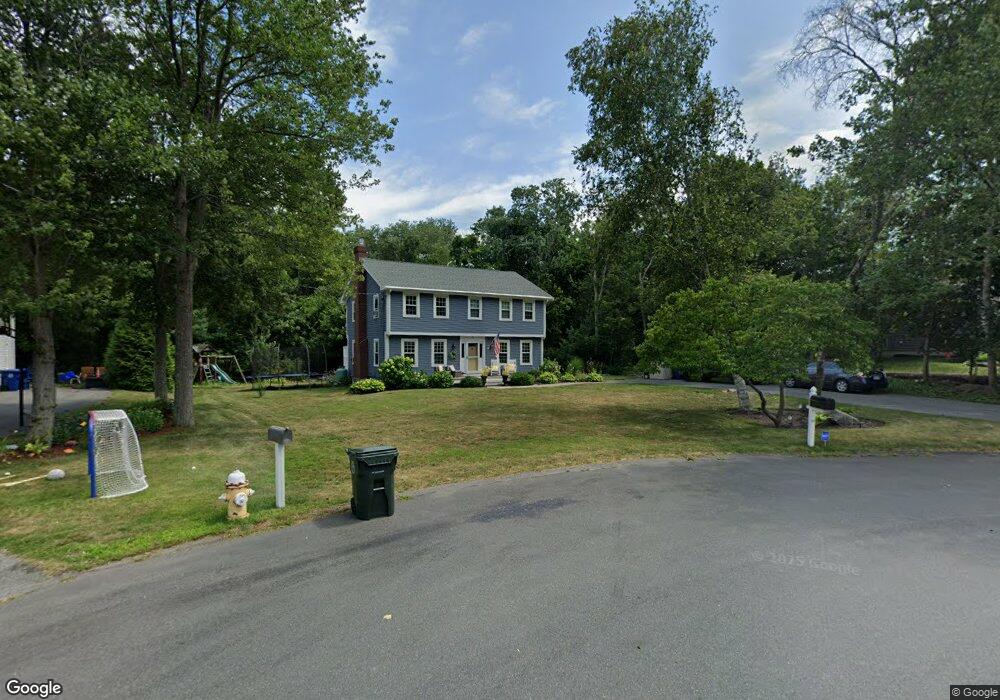
27 Cardinal Rd Danvers, MA 01923
Estimated Value: $780,281 - $933,000
4
Beds
2
Baths
2,088
Sq Ft
$421/Sq Ft
Est. Value
About This Home
This home is located at 27 Cardinal Rd, Danvers, MA 01923 and is currently estimated at $879,320, approximately $421 per square foot. 27 Cardinal Rd is a home located in Essex County with nearby schools including Danvers High School, The Saints Academy, and St. Mary of the Annunciation School.
Ownership History
Date
Name
Owned For
Owner Type
Purchase Details
Closed on
Mar 15, 2022
Sold by
Clark Barbara C and Clark Justin R
Bought by
Clark Family 2022 Ret and Clark
Current Estimated Value
Purchase Details
Closed on
Dec 30, 2010
Sold by
Hanley James A and Hanley Janice
Bought by
Clark Justin R and Clark Barbara C
Purchase Details
Closed on
Sep 8, 1997
Sold by
Nakajima Hisao
Bought by
Hanley James A
Purchase Details
Closed on
May 30, 1990
Sold by
Milczarek Michael
Bought by
Nakajima Hisao
Create a Home Valuation Report for This Property
The Home Valuation Report is an in-depth analysis detailing your home's value as well as a comparison with similar homes in the area
Home Values in the Area
Average Home Value in this Area
Purchase History
| Date | Buyer | Sale Price | Title Company |
|---|---|---|---|
| Clark Family 2022 Ret | -- | None Available | |
| Clark Justin R | $375,000 | -- | |
| Hanley James A | $160,000 | -- | |
| Nakajima Hisao | $230,000 | -- |
Source: Public Records
Mortgage History
| Date | Status | Borrower | Loan Amount |
|---|---|---|---|
| Previous Owner | Nakajima Hisao | $311,000 | |
| Previous Owner | Nakajima Hisao | $315,800 |
Source: Public Records
Tax History
| Year | Tax Paid | Tax Assessment Tax Assessment Total Assessment is a certain percentage of the fair market value that is determined by local assessors to be the total taxable value of land and additions on the property. | Land | Improvement |
|---|---|---|---|---|
| 2025 | $7,304 | $664,600 | $332,700 | $331,900 |
| 2024 | $7,235 | $651,200 | $332,700 | $318,500 |
| 2023 | $7,039 | $599,100 | $302,300 | $296,800 |
| 2022 | $6,940 | $548,200 | $274,300 | $273,900 |
| 2021 | $6,643 | $497,600 | $259,900 | $237,700 |
| 2020 | $6,346 | $485,900 | $256,800 | $229,100 |
| 2019 | $6,046 | $455,300 | $233,500 | $221,800 |
| 2018 | $5,866 | $433,200 | $231,100 | $202,100 |
| 2017 | $5,520 | $389,000 | $202,000 | $187,000 |
| 2016 | $5,311 | $374,000 | $192,600 | $181,400 |
| 2015 | $5,150 | $345,400 | $175,100 | $170,300 |
Source: Public Records
Map
Nearby Homes
- 508 Elliott St
- 44 Foster St
- 13 Giles Ave Unit 2
- 59 Riverview Ave
- 6 Mcdewell Ave Unit 4
- 147 High St
- 61 Ellsworth Ave
- 34 Bayview Terrace Unit 5
- 76 Water St
- 50 Balch St Unit 300
- 50 Balch St Unit 205
- 11 Riverside Ave Unit 111
- 123 Livingstone Ave
- 125 Livingstone Ave
- 55 Burley St
- 14 Chase St
- 6 Grant St
- 14 Grove St
- 6 Pilgrim Heights
- 29 Conant St
Your Personal Tour Guide
Ask me questions while you tour the home.