27 Cedar Ln Bedford, TX 76021
Estimated Value: $260,000 - $281,748
2
Beds
2
Baths
1,609
Sq Ft
$170/Sq Ft
Est. Value
About This Home
This home is located at 27 Cedar Ln, Bedford, TX 76021 and is currently estimated at $273,687, approximately $170 per square foot. 27 Cedar Ln is a home located in Tarrant County with nearby schools including Shady Brook Elementary School, Bedford Junior High School, and L.D. Bell High School.
Ownership History
Date
Name
Owned For
Owner Type
Purchase Details
Closed on
Jun 21, 2018
Sold by
Scullin Stephen Kevin and Scullin Kevin
Bought by
Scullin Stephen Kevin
Current Estimated Value
Purchase Details
Closed on
May 25, 2016
Sold by
Garsaud John Robert
Bought by
Scullin Kevin
Purchase Details
Closed on
Mar 31, 2005
Sold by
Harrison Doris and Harrison Samuel Glenn
Bought by
Gilman Peter J and Gilman Shirley S
Purchase Details
Closed on
Jun 15, 1999
Sold by
Runnels John and Runnels Grace
Bought by
Garsaud Jewel
Home Financials for this Owner
Home Financials are based on the most recent Mortgage that was taken out on this home.
Original Mortgage
$48,000
Interest Rate
7.02%
Purchase Details
Closed on
Apr 26, 1999
Sold by
Kesling Gary L and Kesling Sheila C
Bought by
Runnels John and Runnels Grace
Home Financials for this Owner
Home Financials are based on the most recent Mortgage that was taken out on this home.
Original Mortgage
$48,000
Interest Rate
7.02%
Create a Home Valuation Report for This Property
The Home Valuation Report is an in-depth analysis detailing your home's value as well as a comparison with similar homes in the area
Home Values in the Area
Average Home Value in this Area
Purchase History
| Date | Buyer | Sale Price | Title Company |
|---|---|---|---|
| Scullin Stephen Kevin | -- | None Available | |
| Scullin Kevin | -- | None Available | |
| Gilman Peter J | -- | -- | |
| Garsaud Jewel | -- | Rattikin Title Co | |
| Runnels John | -- | Rattikin Title |
Source: Public Records
Mortgage History
| Date | Status | Borrower | Loan Amount |
|---|---|---|---|
| Previous Owner | Garsaud Jewel | $48,000 | |
| Previous Owner | Runnels John | $60,000 |
Source: Public Records
Tax History Compared to Growth
Tax History
| Year | Tax Paid | Tax Assessment Tax Assessment Total Assessment is a certain percentage of the fair market value that is determined by local assessors to be the total taxable value of land and additions on the property. | Land | Improvement |
|---|---|---|---|---|
| 2025 | $5,101 | $229,955 | $25,000 | $204,955 |
| 2024 | $5,101 | $262,000 | $25,000 | $237,000 |
| 2023 | $5,297 | $276,174 | $25,000 | $251,174 |
| 2022 | $5,380 | $246,332 | $25,000 | $221,332 |
| 2021 | $4,373 | $185,642 | $25,000 | $160,642 |
| 2020 | $4,537 | $190,836 | $25,000 | $165,836 |
| 2019 | $4,417 | $181,797 | $25,000 | $156,797 |
| 2018 | $3,990 | $164,245 | $25,000 | $139,245 |
| 2017 | $3,629 | $150,016 | $25,000 | $125,016 |
| 2016 | $3,050 | $126,097 | $25,000 | $101,097 |
| 2015 | $2,833 | $112,800 | $7,000 | $105,800 |
| 2014 | $2,833 | $112,800 | $7,000 | $105,800 |
Source: Public Records
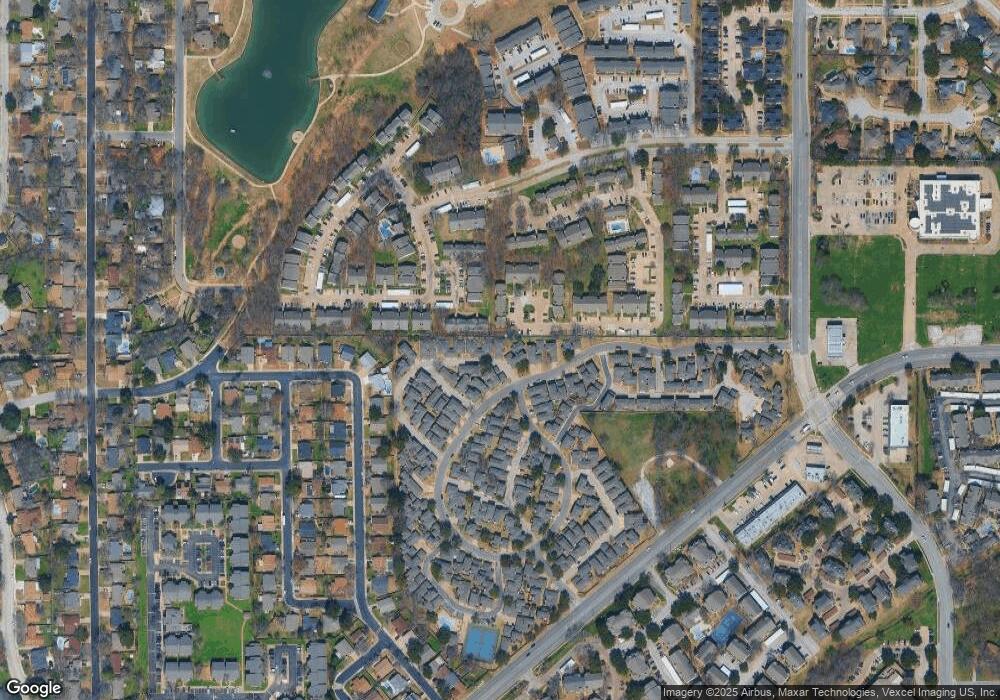
Map
Nearby Homes
- 49 Morrow Dr
- 31 Morrow Dr
- 18 Park Ln
- 6 Park Ln
- 2503 Shady Ridge Dr
- 2524 Shady Ridge Dr
- 1601 Warwickshire Ct W
- 2317 Shady Grove Dr
- 2225 Shady Brook Dr
- 2508 Lakeview Dr
- 2501 Shady Grove Dr
- 2116 Tamworth Ct
- 2420 Stonegate Dr N
- 2700 Shady Grove Dr
- 2704 Shady Grove Dr
- 37 Devonshire Dr
- 345 Somerset Cir
- 2901 Miles Way
- 258 Somerset Terrace
- 1013 Springdale Rd