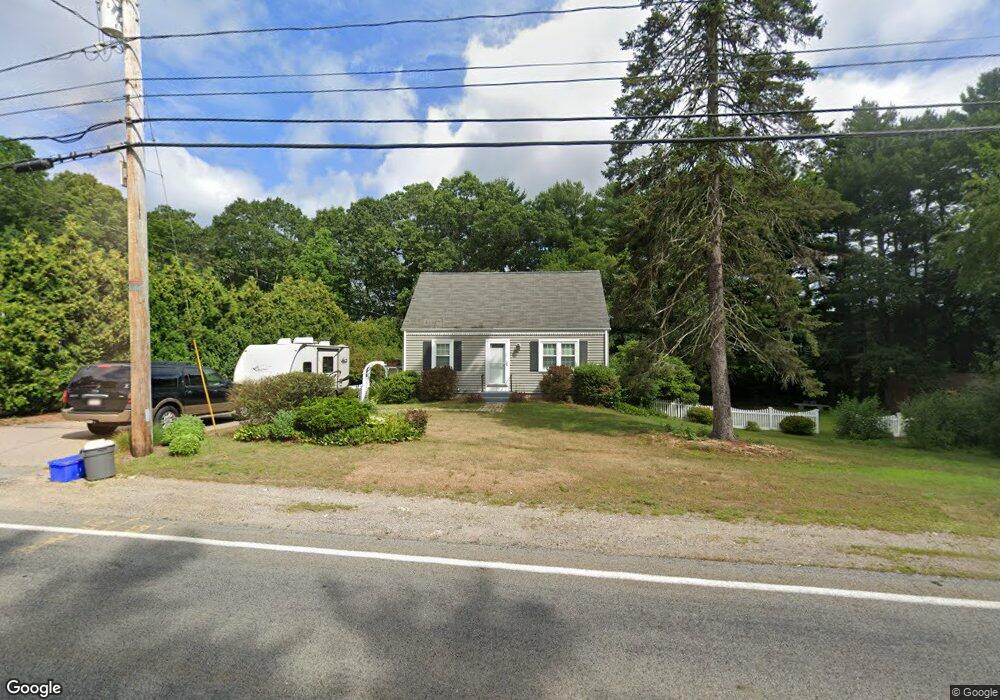
27 Cedar St Foxboro, MA 02035
Estimated Value: $502,838 - $610,000
3
Beds
1
Bath
1,080
Sq Ft
$504/Sq Ft
Est. Value
About This Home
This home is located at 27 Cedar St, Foxboro, MA 02035 and is currently estimated at $544,710, approximately $504 per square foot. 27 Cedar St is a home located in Norfolk County with nearby schools including Foxborough High School, Foxborough Regional Charter School, and Discovery Daycare Center.
Ownership History
Date
Name
Owned For
Owner Type
Purchase Details
Closed on
Sep 28, 2004
Sold by
Kerr James J and Kerr Natalie C
Bought by
Murphy Craig W and Murphy Rosamond E
Current Estimated Value
Home Financials for this Owner
Home Financials are based on the most recent Mortgage that was taken out on this home.
Original Mortgage
$240,000
Outstanding Balance
$119,815
Interest Rate
5.89%
Mortgage Type
Purchase Money Mortgage
Estimated Equity
$424,895
Create a Home Valuation Report for This Property
The Home Valuation Report is an in-depth analysis detailing your home's value as well as a comparison with similar homes in the area
Home Values in the Area
Average Home Value in this Area
Purchase History
| Date | Buyer | Sale Price | Title Company |
|---|---|---|---|
| Murphy Craig W | $300,000 | -- |
Source: Public Records
Mortgage History
| Date | Status | Borrower | Loan Amount |
|---|---|---|---|
| Open | Murphy Craig W | $240,000 | |
| Closed | Murphy Craig W | $45,000 |
Source: Public Records
Tax History
| Year | Tax Paid | Tax Assessment Tax Assessment Total Assessment is a certain percentage of the fair market value that is determined by local assessors to be the total taxable value of land and additions on the property. | Land | Improvement |
|---|---|---|---|---|
| 2025 | $5,181 | $391,900 | $186,100 | $205,800 |
| 2024 | $5,453 | $403,600 | $218,900 | $184,700 |
| 2023 | $5,327 | $374,900 | $208,400 | $166,500 |
| 2022 | $4,960 | $341,600 | $181,200 | $160,400 |
| 2021 | $4,639 | $314,700 | $163,100 | $151,600 |
| 2020 | $4,496 | $308,600 | $163,100 | $145,500 |
| 2019 | $4,325 | $294,200 | $155,300 | $138,900 |
| 2018 | $4,250 | $291,700 | $155,300 | $136,400 |
| 2017 | $4,332 | $288,000 | $161,300 | $126,700 |
| 2016 | $3,723 | $251,200 | $118,300 | $132,900 |
| 2015 | $3,658 | $240,800 | $107,900 | $132,900 |
| 2014 | $3,610 | $240,800 | $107,900 | $132,900 |
Source: Public Records
Map
Nearby Homes
- 17 Childs Ln
- 25 Shepherd St
- 40 Treasure Island Rd
- 401 South St
- 26 Pinto Way
- 16 Treasure Island Rd
- 33 Colonial Way
- 9 Coach Rd
- 84 Messenger St
- 346 South St
- 128 Tremont St
- 1769 West St
- 85 Jewell St
- 25 Munroe Dr
- 126 Washington St
- 130 Washington St
- 124 Washington St
- 28 Messenger St
- 158 Washington St
- 89 Oak Crest Dr
Your Personal Tour Guide
Ask me questions while you tour the home.