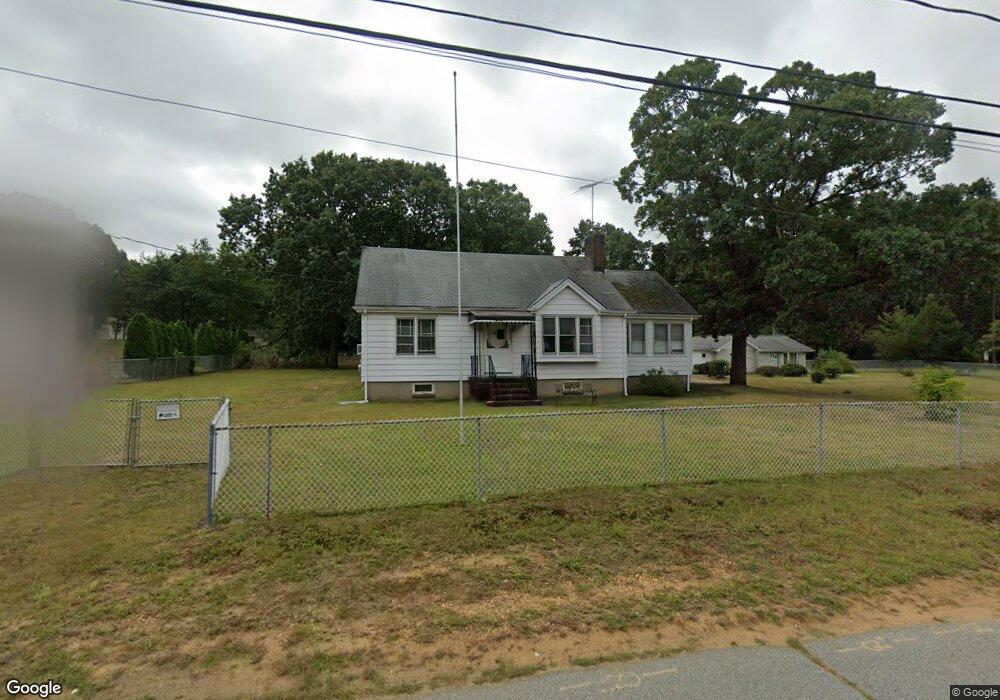
27 Central Ave Old Bridge, NJ 08857
Estimated Value: $473,402 - $566,000
4
Beds
2
Baths
1,223
Sq Ft
$434/Sq Ft
Est. Value
About This Home
This home is located at 27 Central Ave, Old Bridge, NJ 08857 and is currently estimated at $530,851, approximately $434 per square foot. 27 Central Ave is a home located in Middlesex County with nearby schools including Old Bridge High School and St. Thomas the Apostle School.
Ownership History
Date
Name
Owned For
Owner Type
Purchase Details
Closed on
Feb 10, 2022
Sold by
Bamrah Home Improvement Inc
Bought by
Singh Deedar
Current Estimated Value
Purchase Details
Closed on
Jun 18, 2019
Sold by
Denker Gloria
Bought by
Bamrah Home Improvement Inc
Purchase Details
Closed on
Feb 19, 2019
Sold by
Denker Gloria and Estate Of Henry A Denker
Bought by
Denker Gloria
Create a Home Valuation Report for This Property
The Home Valuation Report is an in-depth analysis detailing your home's value as well as a comparison with similar homes in the area
Home Values in the Area
Average Home Value in this Area
Purchase History
| Date | Buyer | Sale Price | Title Company |
|---|---|---|---|
| Singh Deedar | -- | Klouser Peter H | |
| Singh Deedar | -- | Klouser Peter H | |
| Bamrah Home Improvement Inc | $150,000 | Commonwealth Ttl Monmouth Ag | |
| Denker Gloria | -- | None Available |
Source: Public Records
Tax History
| Year | Tax Paid | Tax Assessment Tax Assessment Total Assessment is a certain percentage of the fair market value that is determined by local assessors to be the total taxable value of land and additions on the property. | Land | Improvement |
|---|---|---|---|---|
| 2025 | $7,364 | $130,400 | $56,000 | $74,400 |
| 2024 | $7,064 | $130,400 | $56,000 | $74,400 |
Source: Public Records
Map
Nearby Homes
- 205 Main St
- 14 Brookside Ave
- 289 Main St Unit 6E
- 289 Main St Unit 10F
- 1210 Englishtown Rd
- 321 Main St
- 1283 Englishtown Rd
- 152 Austin Ave
- 12 Brookside Rd
- 21 Fourth St
- 1299 Englishtown Rd
- 24 Kensington Ave
- 44 Shirley Blvd
- 27 Harrison Ave
- 25 Evergreen St
- 4 North St
- 5 Elaine Ct
- 98 Madison Ave
- 213 Summerhill Rd
- 857 Englishtown Rd