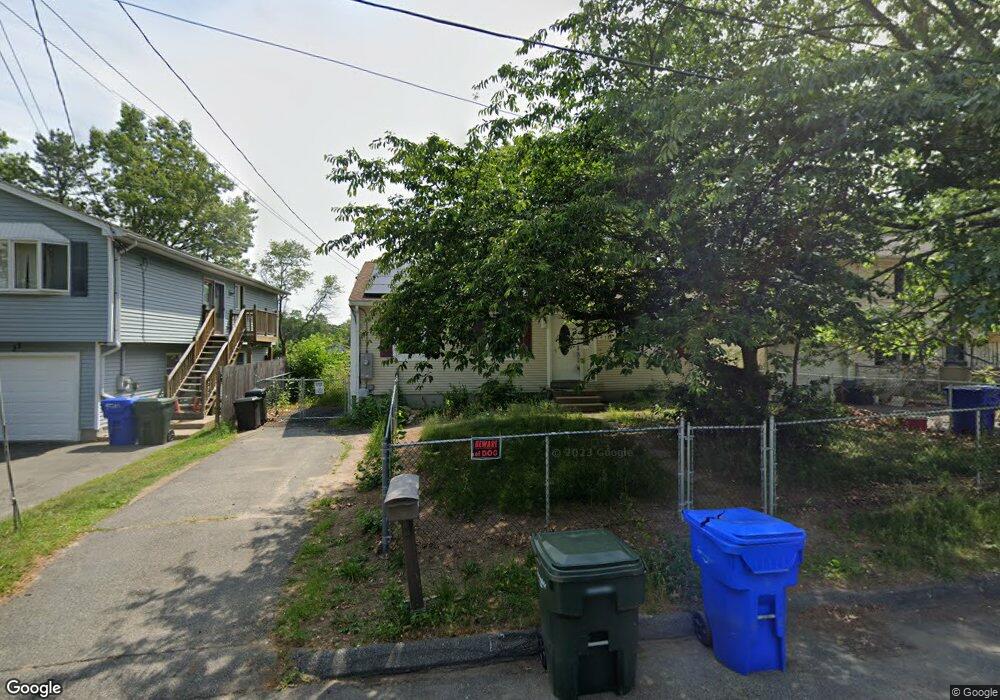
27 Chapman St Indian Orchard, MA 01151
Estimated Value: $239,000 - $291,000
3
Beds
1
Bath
1,008
Sq Ft
$268/Sq Ft
Est. Value
About This Home
This home is located at 27 Chapman St, Indian Orchard, MA 01151 and is currently estimated at $270,263, approximately $268 per square foot. 27 Chapman St is a home located in Hampden County with nearby schools including Indian Orchard Elementary School, John F. Kennedy Academy, and Roger L. Putnam Vocational Technical Academy.
Ownership History
Date
Name
Owned For
Owner Type
Purchase Details
Closed on
May 4, 2004
Sold by
Gonzalez Ana M and Massa Juana P
Bought by
Acevedo Andy
Current Estimated Value
Home Financials for this Owner
Home Financials are based on the most recent Mortgage that was taken out on this home.
Original Mortgage
$94,400
Outstanding Balance
$43,824
Interest Rate
5.36%
Mortgage Type
Purchase Money Mortgage
Estimated Equity
$226,439
Purchase Details
Closed on
Oct 1, 1993
Sold by
Turn Key Homes Inc
Bought by
Massa Juana P and Gonzalez Ana M
Home Financials for this Owner
Home Financials are based on the most recent Mortgage that was taken out on this home.
Original Mortgage
$78,501
Interest Rate
7%
Mortgage Type
Purchase Money Mortgage
Purchase Details
Closed on
Jun 9, 1993
Sold by
Libiszewski Carol J
Bought by
Turn Key Homes Inc
Home Financials for this Owner
Home Financials are based on the most recent Mortgage that was taken out on this home.
Original Mortgage
$40,000
Interest Rate
7.41%
Mortgage Type
Purchase Money Mortgage
Create a Home Valuation Report for This Property
The Home Valuation Report is an in-depth analysis detailing your home's value as well as a comparison with similar homes in the area
Home Values in the Area
Average Home Value in this Area
Purchase History
| Date | Buyer | Sale Price | Title Company |
|---|---|---|---|
| Acevedo Andy | $130,000 | -- | |
| Massa Juana P | $79,900 | -- | |
| Turn Key Homes Inc | $10,000 | -- |
Source: Public Records
Mortgage History
| Date | Status | Borrower | Loan Amount |
|---|---|---|---|
| Open | Acevedo Andy | $94,400 | |
| Previous Owner | Turn Key Homes Inc | $78,501 | |
| Previous Owner | Turn Key Homes Inc | $10,000 | |
| Previous Owner | Turn Key Homes Inc | $40,000 |
Source: Public Records
Tax History Compared to Growth
Tax History
| Year | Tax Paid | Tax Assessment Tax Assessment Total Assessment is a certain percentage of the fair market value that is determined by local assessors to be the total taxable value of land and additions on the property. | Land | Improvement |
|---|---|---|---|---|
| 2025 | $3,668 | $233,900 | $43,700 | $190,200 |
| 2024 | $3,575 | $222,600 | $40,900 | $181,700 |
| 2023 | $3,427 | $201,000 | $33,500 | $167,500 |
| 2022 | $3,103 | $164,900 | $31,300 | $133,600 |
| 2021 | $2,979 | $157,600 | $28,500 | $129,100 |
| 2020 | $2,775 | $142,100 | $28,500 | $113,600 |
| 2019 | $2,570 | $130,600 | $29,500 | $101,100 |
| 2018 | $2,511 | $127,600 | $29,500 | $98,100 |
| 2017 | $2,355 | $119,800 | $25,100 | $94,700 |
| 2016 | $2,265 | $115,200 | $25,100 | $90,100 |
| 2015 | $2,191 | $111,400 | $25,100 | $86,300 |
Source: Public Records
Map
Nearby Homes