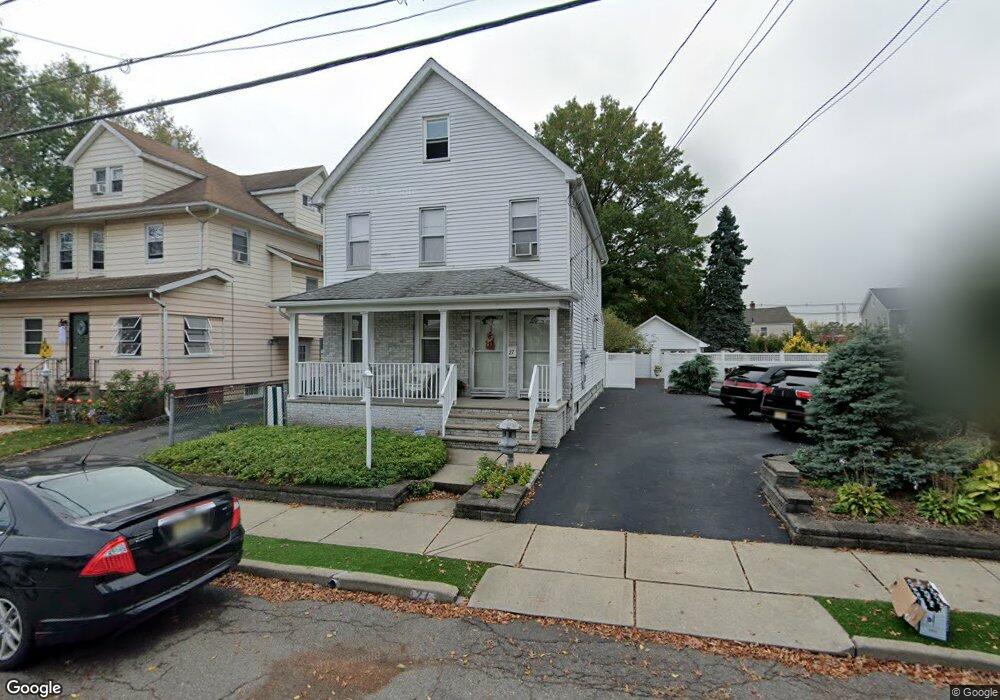
27 Chase St Nutley, NJ 07110
Estimated Value: $545,000 - $665,000
Studio
--
Bath
1,628
Sq Ft
$370/Sq Ft
Est. Value
About This Home
This home is located at 27 Chase St, Nutley, NJ 07110 and is currently estimated at $602,028, approximately $369 per square foot. 27 Chase St is a home located in Essex County with nearby schools including Nutley High School and Good Shepherd Academy.
Ownership History
Date
Name
Owned For
Owner Type
Purchase Details
Closed on
Jun 21, 2023
Sold by
Paladino Anthony
Bought by
Paladino Sandra L
Current Estimated Value
Purchase Details
Closed on
Jan 19, 1996
Sold by
Karpson Helen
Bought by
Paladino Anthony and Toppeta Sandra
Home Financials for this Owner
Home Financials are based on the most recent Mortgage that was taken out on this home.
Original Mortgage
$142,000
Interest Rate
7.13%
Create a Home Valuation Report for This Property
The Home Valuation Report is an in-depth analysis detailing your home's value as well as a comparison with similar homes in the area
Home Values in the Area
Average Home Value in this Area
Purchase History
| Date | Buyer | Sale Price | Title Company |
|---|---|---|---|
| Paladino Sandra L | -- | None Listed On Document | |
| Paladino Anthony | $177,000 | -- |
Source: Public Records
Mortgage History
| Date | Status | Borrower | Loan Amount |
|---|---|---|---|
| Previous Owner | Paladino Anthony | $142,000 |
Source: Public Records
Tax History
| Year | Tax Paid | Tax Assessment Tax Assessment Total Assessment is a certain percentage of the fair market value that is determined by local assessors to be the total taxable value of land and additions on the property. | Land | Improvement |
|---|---|---|---|---|
| 2025 | $11,631 | $451,500 | $197,600 | $253,900 |
| 2024 | $11,631 | $451,500 | $197,600 | $253,900 |
| 2022 | $10,819 | $280,000 | $106,700 | $173,300 |
| 2021 | $10,763 | $280,000 | $106,700 | $173,300 |
| 2020 | $10,310 | $280,000 | $106,700 | $173,300 |
| 2019 | $10,102 | $280,000 | $106,700 | $173,300 |
| 2018 | $9,831 | $280,000 | $106,700 | $173,300 |
| 2017 | $9,724 | $280,000 | $106,700 | $173,300 |
| 2016 | $9,436 | $280,000 | $106,700 | $173,300 |
| 2015 | $9,285 | $280,000 | $106,700 | $173,300 |
| 2014 | $9,167 | $280,000 | $106,700 | $173,300 |
Source: Public Records
Map
Nearby Homes
- 145 Harrison St
- 149 Crestwood Ave
- 8 Essex St
- 71 Spring St
- 19 Entwistle Ave
- 20 Harrison St
- 62 Sycamore Dr
- 53 Passaic Ave
- 27 Passaic Ave
- 108-110 Passaic Ave Unit 21
- 190 Conover Ave
- 78 Jannarone St Unit B
- 45 Rutan Rd
- 70 Kierstead Ave
- 71 Wilber St
- 10 Hill St
- 74 Wilber St
- 838 Joralemon St
- 476 Harrison St
- 14 Dorothea Terrace
Your Personal Tour Guide
Ask me questions while you tour the home.