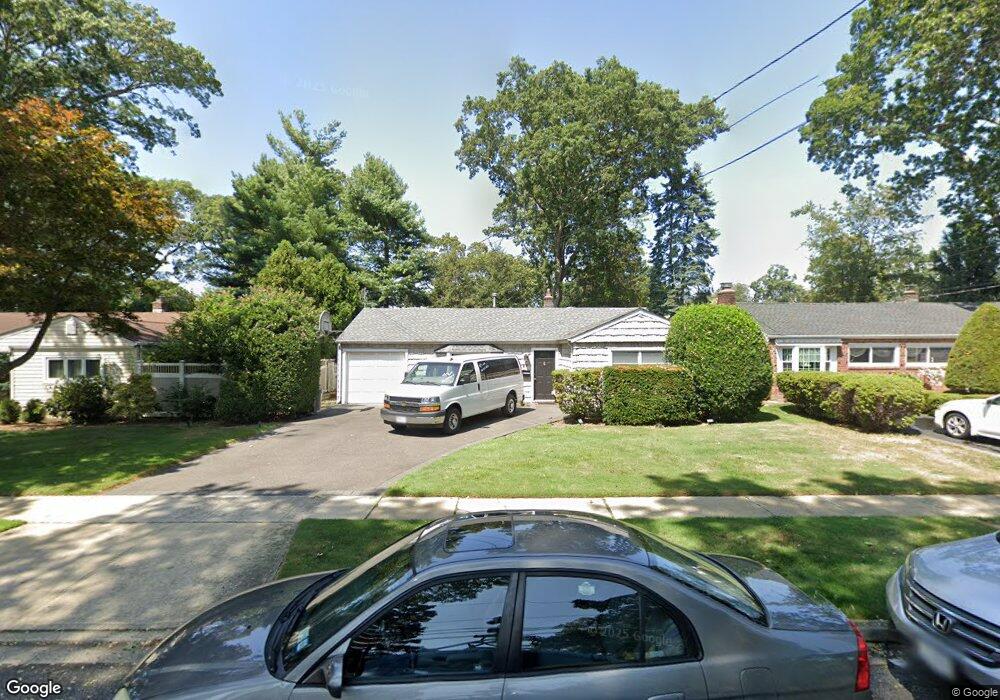
27 Cherry St Massapequa, NY 11758
Estimated Value: $665,000 - $819,000
3
Beds
1
Bath
1,260
Sq Ft
$569/Sq Ft
Est. Value
About This Home
This home is located at 27 Cherry St, Massapequa, NY 11758 and is currently estimated at $717,557, approximately $569 per square foot. 27 Cherry St is a home located in Nassau County with nearby schools including Massapequa High School - Ames Campus, Berner Middle School, and Massapequa High School.
Ownership History
Date
Name
Owned For
Owner Type
Purchase Details
Closed on
Jul 21, 2022
Sold by
Obregon Dario
Bought by
East Cherry Ventures Corp
Current Estimated Value
Purchase Details
Closed on
Mar 16, 2022
Sold by
Masel Enterprises Inc
Bought by
Obregon Dario
Home Financials for this Owner
Home Financials are based on the most recent Mortgage that was taken out on this home.
Original Mortgage
$480,000
Interest Rate
3.85%
Mortgage Type
New Conventional
Purchase Details
Closed on
Jun 14, 2021
Sold by
Neargarder Edward and Neargarder Denise
Bought by
Masel Enterprises Inc
Purchase Details
Closed on
Sep 1, 2005
Sold by
Alesi Peter
Bought by
Neargarder Edward
Purchase Details
Closed on
Aug 14, 2000
Sold by
Delgiorno Frederick and Delgiorno Anita
Bought by
Alesi Peter
Create a Home Valuation Report for This Property
The Home Valuation Report is an in-depth analysis detailing your home's value as well as a comparison with similar homes in the area
Home Values in the Area
Average Home Value in this Area
Purchase History
| Date | Buyer | Sale Price | Title Company |
|---|---|---|---|
| East Cherry Ventures Corp | -- | Judicial Title | |
| Obregon Dario | -- | First American Mortgage Sln | |
| Masel Enterprises Inc | $450,000 | Judicial Title | |
| Neargarder Edward | $452,500 | -- | |
| Alesi Peter | $267,500 | Debra Berley |
Source: Public Records
Mortgage History
| Date | Status | Borrower | Loan Amount |
|---|---|---|---|
| Previous Owner | Obregon Dario | $480,000 |
Source: Public Records
Tax History
| Year | Tax Paid | Tax Assessment Tax Assessment Total Assessment is a certain percentage of the fair market value that is determined by local assessors to be the total taxable value of land and additions on the property. | Land | Improvement |
|---|---|---|---|---|
| 2025 | $11,169 | $392 | $167 | $225 |
| 2024 | $3,276 | $389 | $166 | $223 |
Source: Public Records
Map
Nearby Homes
- 54 Chestnut St
- 21 Chestnut St
- 60 Cherry St
- 85 Riverside Ave
- 69 Hawthorne St
- 2125 North Dr
- 2097 Washington Ave
- 1967 Washington Ave
- 63 Pennsylvania Ave
- 36 Michigan Ave
- 3993 Fulton Ave
- 187 Massapequa Ave
- 51 Michigan Ave
- 3861 Wilburne Ave
- 4460 Merrick Rd
- 3933 Fulton Ave
- 84 Ohio Ave
- 2162 Seamans Neck Rd
- 32 Saint Marks Place
- 3887 Hudson Ave
Your Personal Tour Guide
Ask me questions while you tour the home.