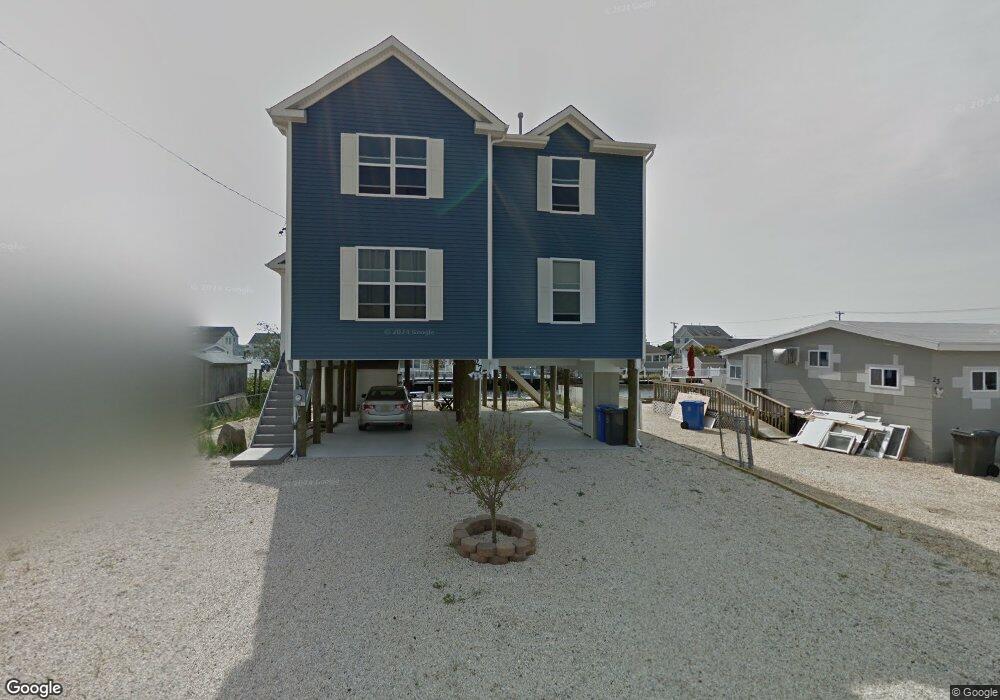
27 Clarence Dr Manahawkin, NJ 08050
Stafford NeighborhoodEstimated Value: $977,000 - $1,331,000
3
Beds
1
Bath
2,200
Sq Ft
$513/Sq Ft
Est. Value
About This Home
This home is located at 27 Clarence Dr, Manahawkin, NJ 08050 and is currently estimated at $1,129,560, approximately $513 per square foot. 27 Clarence Dr is a home located in Ocean County with nearby schools including Oxycocus Elementary School, Ocean Acres Elementary School, and McKinley Avenue Elementary School.
Ownership History
Date
Name
Owned For
Owner Type
Purchase Details
Closed on
Mar 24, 2011
Sold by
Savarese Philip
Bought by
Abreu Jose and Abreu Isabel
Current Estimated Value
Purchase Details
Closed on
Dec 20, 2010
Sold by
Barba Thomas
Bought by
Savarese Philip
Purchase Details
Closed on
Dec 23, 2002
Sold by
Blaney Deborah
Bought by
Barba Thomas
Home Financials for this Owner
Home Financials are based on the most recent Mortgage that was taken out on this home.
Original Mortgage
$115,000
Interest Rate
6.19%
Purchase Details
Closed on
Nov 1, 1993
Sold by
Linden Alice Vonder
Bought by
Barba Thomas and Barba Deborah
Home Financials for this Owner
Home Financials are based on the most recent Mortgage that was taken out on this home.
Original Mortgage
$30,000
Interest Rate
6.69%
Create a Home Valuation Report for This Property
The Home Valuation Report is an in-depth analysis detailing your home's value as well as a comparison with similar homes in the area
Home Values in the Area
Average Home Value in this Area
Purchase History
| Date | Buyer | Sale Price | Title Company |
|---|---|---|---|
| Abreu Jose | $205,000 | Surety Title Agency Coastal | |
| Savarese Philip | $155,000 | Or | |
| Barba Thomas | $20,000 | -- | |
| Barba Thomas | $40,000 | -- |
Source: Public Records
Mortgage History
| Date | Status | Borrower | Loan Amount |
|---|---|---|---|
| Previous Owner | Barba Thomas | $115,000 | |
| Previous Owner | Barba Thomas | $30,000 |
Source: Public Records
Tax History Compared to Growth
Tax History
| Year | Tax Paid | Tax Assessment Tax Assessment Total Assessment is a certain percentage of the fair market value that is determined by local assessors to be the total taxable value of land and additions on the property. | Land | Improvement |
|---|---|---|---|---|
| 2025 | $11,779 | $474,400 | $206,400 | $268,000 |
| 2024 | $11,666 | $474,400 | $206,400 | $268,000 |
| 2023 | $11,167 | $474,400 | $206,400 | $268,000 |
| 2022 | $11,167 | $474,400 | $206,400 | $268,000 |
| 2021 | $11,016 | $474,400 | $206,400 | $268,000 |
| 2020 | $10,621 | $456,800 | $206,400 | $250,400 |
| 2019 | $10,470 | $456,800 | $206,400 | $250,400 |
| 2018 | $10,406 | $456,800 | $206,400 | $250,400 |
| 2017 | $9,671 | $411,000 | $169,500 | $241,500 |
| 2016 | $9,572 | $411,000 | $169,500 | $241,500 |
| 2015 | $9,235 | $174,200 | $169,500 | $4,700 |
| 2014 | $3,897 | $171,300 | $166,900 | $4,400 |
Source: Public Records
Map
Nearby Homes