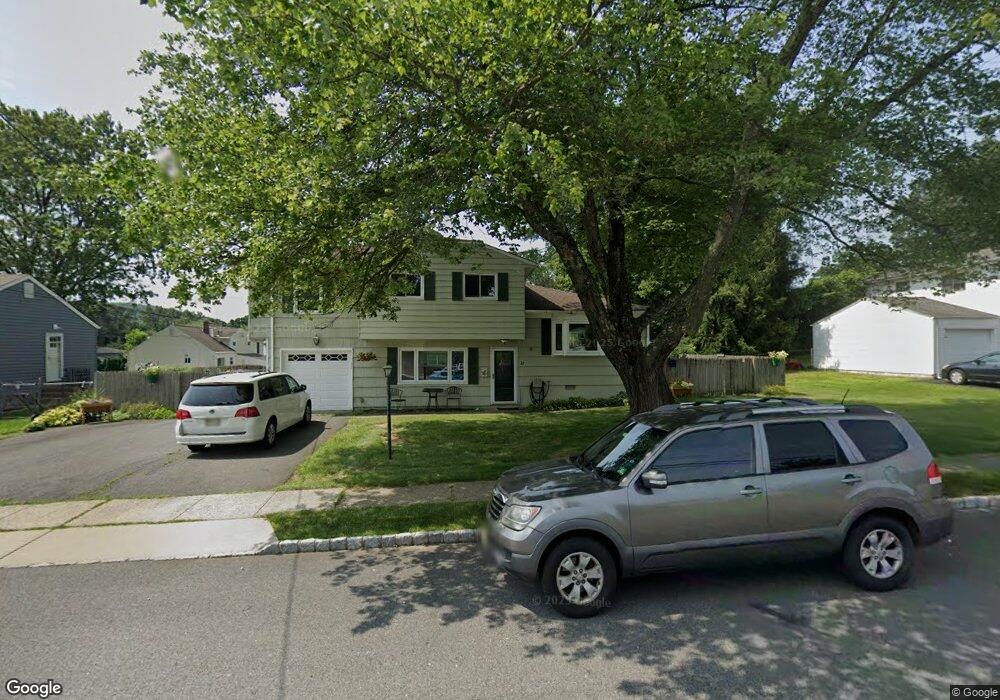
27 Columbia St Wharton, NJ 07885
Estimated Value: $523,000 - $612,000
--
Bed
--
Bath
1,678
Sq Ft
$328/Sq Ft
Est. Value
About This Home
This home is located at 27 Columbia St, Wharton, NJ 07885 and is currently estimated at $550,710, approximately $328 per square foot. 27 Columbia St is a home located in Morris County with nearby schools including Marie V. Duffy Elementary School and A C Mac Kinnon Middle School.
Ownership History
Date
Name
Owned For
Owner Type
Purchase Details
Closed on
Jun 15, 2000
Sold by
J Holder Inc
Bought by
Morris Andrew S and Murphy Jayne I
Current Estimated Value
Home Financials for this Owner
Home Financials are based on the most recent Mortgage that was taken out on this home.
Original Mortgage
$173,250
Outstanding Balance
$61,318
Interest Rate
8.48%
Mortgage Type
FHA
Estimated Equity
$489,392
Purchase Details
Closed on
Jan 28, 2000
Sold by
Cicenia Angelo M and Cicenia Betty J
Bought by
J Holder Inc
Create a Home Valuation Report for This Property
The Home Valuation Report is an in-depth analysis detailing your home's value as well as a comparison with similar homes in the area
Home Values in the Area
Average Home Value in this Area
Purchase History
| Date | Buyer | Sale Price | Title Company |
|---|---|---|---|
| Morris Andrew S | $173,500 | -- | |
| J Holder Inc | $127,420 | -- |
Source: Public Records
Mortgage History
| Date | Status | Borrower | Loan Amount |
|---|---|---|---|
| Open | Morris Andrew S | $173,250 |
Source: Public Records
Tax History Compared to Growth
Tax History
| Year | Tax Paid | Tax Assessment Tax Assessment Total Assessment is a certain percentage of the fair market value that is determined by local assessors to be the total taxable value of land and additions on the property. | Land | Improvement |
|---|---|---|---|---|
| 2025 | $11,034 | $398,800 | $138,500 | $260,300 |
| 2024 | $10,575 | $372,900 | $133,500 | $239,400 |
| 2023 | $10,575 | $353,200 | $133,500 | $219,700 |
| 2022 | $9,037 | $318,400 | $133,500 | $184,900 |
| 2021 | $9,037 | $296,200 | $133,500 | $162,700 |
| 2020 | $8,836 | $284,200 | $133,500 | $150,700 |
| 2019 | $8,355 | $270,900 | $133,500 | $137,400 |
| 2018 | $8,023 | $265,500 | $133,500 | $132,000 |
| 2017 | $7,674 | $251,200 | $133,500 | $117,700 |
| 2016 | $7,177 | $252,100 | $133,500 | $118,600 |
| 2015 | $7,593 | $251,100 | $133,500 | $117,600 |
| 2014 | $7,643 | $250,000 | $133,500 | $116,500 |
Source: Public Records
Map
Nearby Homes