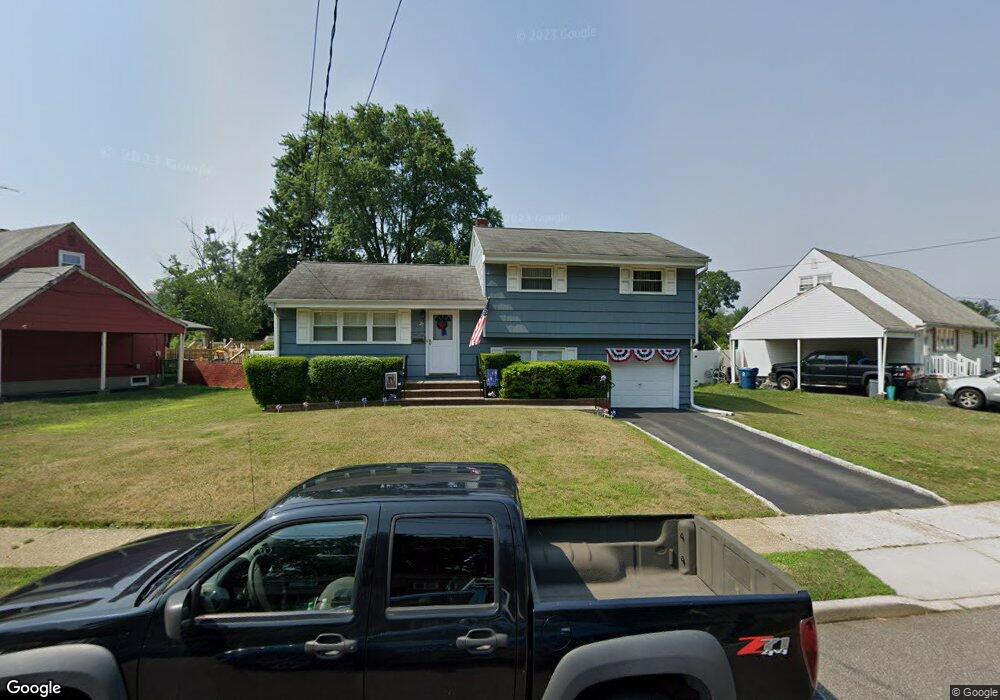
27 Crassas St South Amboy, NJ 08879
Estimated Value: $523,000 - $613,000
3
Beds
2
Baths
1,278
Sq Ft
$431/Sq Ft
Est. Value
About This Home
This home is located at 27 Crassas St, South Amboy, NJ 08879 and is currently estimated at $550,366, approximately $430 per square foot. 27 Crassas St is a home located in Middlesex County with nearby schools including Old Bridge High School, Minding Miracles Learning Center, and Matawan Montessori Academy.
Ownership History
Date
Name
Owned For
Owner Type
Purchase Details
Closed on
Dec 15, 2016
Sold by
Cannizzaro Carmine F and Cannizzaro Richard
Bought by
Mullin Helen
Current Estimated Value
Home Financials for this Owner
Home Financials are based on the most recent Mortgage that was taken out on this home.
Original Mortgage
$185,000
Outstanding Balance
$151,908
Interest Rate
4.08%
Mortgage Type
New Conventional
Estimated Equity
$398,458
Purchase Details
Closed on
Sep 3, 1958
Bought by
Cannizzaro Carmine and Cannizzaro Mary
Create a Home Valuation Report for This Property
The Home Valuation Report is an in-depth analysis detailing your home's value as well as a comparison with similar homes in the area
Home Values in the Area
Average Home Value in this Area
Purchase History
| Date | Buyer | Sale Price | Title Company |
|---|---|---|---|
| Mullin Helen | $285,000 | First American Title | |
| Cannizzaro Carmine | -- | -- |
Source: Public Records
Mortgage History
| Date | Status | Borrower | Loan Amount |
|---|---|---|---|
| Open | Mullin Helen | $185,000 |
Source: Public Records
Tax History Compared to Growth
Tax History
| Year | Tax Paid | Tax Assessment Tax Assessment Total Assessment is a certain percentage of the fair market value that is determined by local assessors to be the total taxable value of land and additions on the property. | Land | Improvement |
|---|---|---|---|---|
| 2025 | $7,495 | $130,400 | $56,200 | $74,200 |
| 2024 | $7,201 | $130,400 | $56,200 | $74,200 |
| 2023 | $7,201 | $130,400 | $56,200 | $74,200 |
| 2022 | $6,978 | $130,400 | $56,200 | $74,200 |
| 2021 | $5,126 | $130,400 | $56,200 | $74,200 |
| 2020 | $6,780 | $130,400 | $56,200 | $74,200 |
| 2019 | $6,675 | $130,400 | $56,200 | $74,200 |
| 2018 | $6,594 | $130,400 | $56,200 | $74,200 |
| 2017 | $6,392 | $130,400 | $56,200 | $74,200 |
| 2016 | $6,262 | $130,400 | $56,200 | $74,200 |
| 2015 | $5,906 | $130,400 | $56,200 | $74,200 |
| 2014 | $5,842 | $130,400 | $56,200 | $74,200 |
Source: Public Records
Map
Nearby Homes