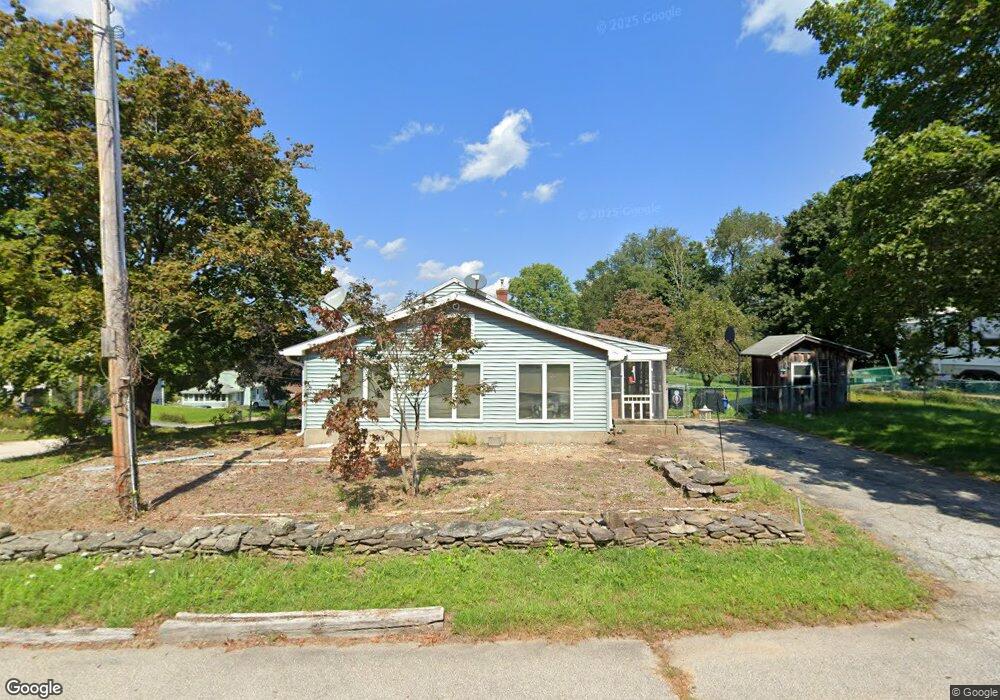
27 Crestview Dr Southbridge, MA 01550
Estimated Value: $354,000 - $365,000
3
Beds
2
Baths
1,380
Sq Ft
$261/Sq Ft
Est. Value
About This Home
This home is located at 27 Crestview Dr, Southbridge, MA 01550 and is currently estimated at $359,729, approximately $260 per square foot. 27 Crestview Dr is a home located in Worcester County with nearby schools including Trinity Catholic Academy and ViewPoint Christian Academy.
Ownership History
Date
Name
Owned For
Owner Type
Purchase Details
Closed on
Aug 17, 2017
Sold by
Ceminski Mary-Linn and Ceminski Robert T
Bought by
Sansoucy Elaine J
Current Estimated Value
Purchase Details
Closed on
Jan 25, 2010
Sold by
Joan P Quevillon Ret and Macwilliams
Bought by
Macwilliams Robert W
Purchase Details
Closed on
Jan 27, 2009
Sold by
Quevillon Joan P
Bought by
Joan P Quevillon Ret and Quevillon
Create a Home Valuation Report for This Property
The Home Valuation Report is an in-depth analysis detailing your home's value as well as a comparison with similar homes in the area
Home Values in the Area
Average Home Value in this Area
Purchase History
| Date | Buyer | Sale Price | Title Company |
|---|---|---|---|
| Sansoucy Elaine J | -- | -- | |
| Sansoucy Elaine J | -- | -- | |
| Macwilliams Robert W | -- | -- | |
| Macwilliams Robert W | -- | -- | |
| Joan P Quevillon Ret | -- | -- | |
| Joan P Quevillon Ret | -- | -- |
Source: Public Records
Mortgage History
| Date | Status | Borrower | Loan Amount |
|---|---|---|---|
| Previous Owner | Joan P Quevillon Ret | $129,900 |
Source: Public Records
Tax History Compared to Growth
Tax History
| Year | Tax Paid | Tax Assessment Tax Assessment Total Assessment is a certain percentage of the fair market value that is determined by local assessors to be the total taxable value of land and additions on the property. | Land | Improvement |
|---|---|---|---|---|
| 2025 | $4,159 | $283,700 | $39,000 | $244,700 |
| 2024 | $3,652 | $239,300 | $32,500 | $206,800 |
| 2023 | $3,732 | $235,600 | $32,500 | $203,100 |
| 2022 | $3,340 | $196,800 | $27,800 | $169,000 |
| 2021 | $10,827 | $171,800 | $27,800 | $144,000 |
| 2020 | $10,516 | $164,000 | $27,800 | $136,200 |
| 2018 | $3,021 | $145,600 | $27,800 | $117,800 |
| 2017 | $2,800 | $136,100 | $27,800 | $108,300 |
| 2016 | $2,736 | $135,400 | $31,900 | $103,500 |
| 2015 | $3,030 | $148,800 | $31,900 | $116,900 |
| 2014 | $2,807 | $142,900 | $31,900 | $111,000 |
Source: Public Records
Map
Nearby Homes
- 29 Hudson Ave
- 36 Litchfield Ave
- 77 Westwood Pkwy
- 444 Dennison Dr
- 20 Glover St
- 72 High St
- 467 Durfee St
- 38 Glenwood Ave
- 15 Bruce Ln
- 21 Orchard St
- 6 Walcott St
- 170 Shepard Rd
- 172 Marcy St
- 209 Marcy St
- 134 Pleasant St
- Lot 1 Berry Farms Road-2 Acre
- 691 Dennison Dr
- 29 Fiske St
- 45 River St
- 48 Dennison Hill Rd