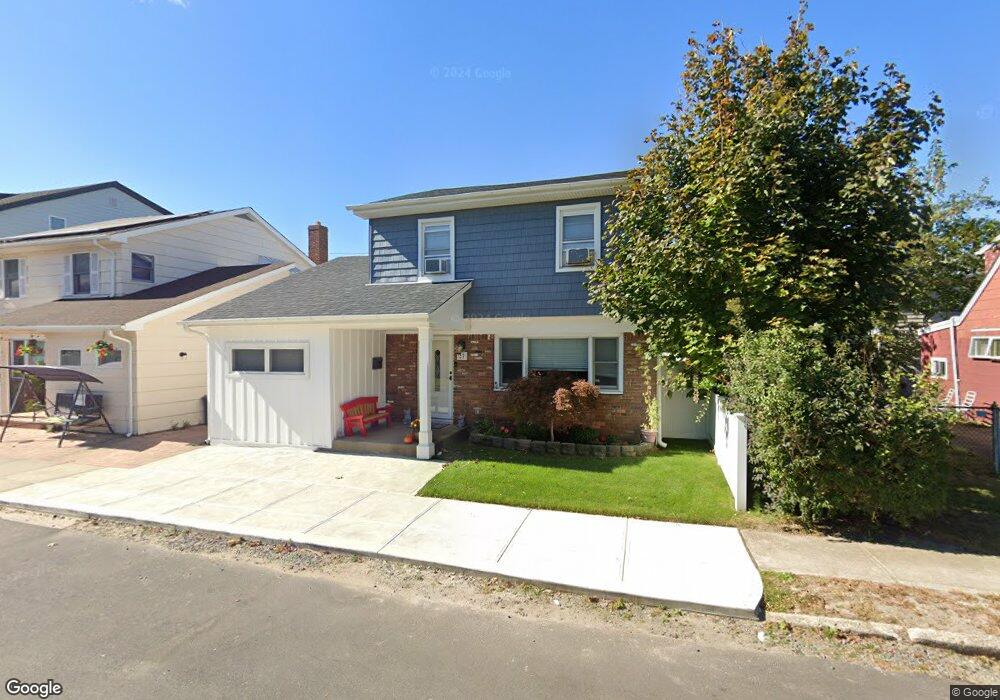
27 Curley St Long Beach, NY 11561
Estimated Value: $807,190 - $833,000
4
Beds
2
Baths
1,668
Sq Ft
$492/Sq Ft
Est. Value
About This Home
This home is located at 27 Curley St, Long Beach, NY 11561 and is currently estimated at $820,095, approximately $491 per square foot. 27 Curley St is a home located in Nassau County with nearby schools including Lido Elementary School, East Elementary School, and Lindell Elementary School.
Ownership History
Date
Name
Owned For
Owner Type
Purchase Details
Closed on
Apr 23, 2018
Sold by
Mangino Michael and Mangino Jennifer
Bought by
Bleecker Rachel D and Bleecker Todd S
Current Estimated Value
Home Financials for this Owner
Home Financials are based on the most recent Mortgage that was taken out on this home.
Original Mortgage
$448,000
Outstanding Balance
$385,362
Interest Rate
4.45%
Mortgage Type
New Conventional
Estimated Equity
$434,733
Purchase Details
Closed on
Jun 12, 2009
Sold by
Daly Robert E
Bought by
Mangino Michael and Fahr Jennifer
Home Financials for this Owner
Home Financials are based on the most recent Mortgage that was taken out on this home.
Original Mortgage
$352,000
Interest Rate
4.92%
Mortgage Type
Purchase Money Mortgage
Purchase Details
Closed on
Feb 25, 1997
Sold by
Koulias Barbara
Bought by
Daly Robert E and Daly Margaret
Create a Home Valuation Report for This Property
The Home Valuation Report is an in-depth analysis detailing your home's value as well as a comparison with similar homes in the area
Home Values in the Area
Average Home Value in this Area
Purchase History
| Date | Buyer | Sale Price | Title Company |
|---|---|---|---|
| Bleecker Rachel D | $560,000 | -- | |
| Mangino Michael | $440,000 | -- | |
| Daly Robert E | $175,000 | -- |
Source: Public Records
Mortgage History
| Date | Status | Borrower | Loan Amount |
|---|---|---|---|
| Open | Bleecker Rachel D | $448,000 | |
| Previous Owner | Mangino Michael | $352,000 |
Source: Public Records
Tax History Compared to Growth
Tax History
| Year | Tax Paid | Tax Assessment Tax Assessment Total Assessment is a certain percentage of the fair market value that is determined by local assessors to be the total taxable value of land and additions on the property. | Land | Improvement |
|---|---|---|---|---|
| 2025 | $7,689 | $534 | $182 | $352 |
| 2024 | $946 | $523 | $178 | $345 |
| 2023 | $7,182 | $517 | $176 | $341 |
| 2022 | $7,182 | $560 | $191 | $369 |
| 2021 | $15,232 | $536 | $183 | $353 |
| 2020 | $11,303 | $807 | $510 | $297 |
| 2019 | $1,447 | $1,046 | $661 | $385 |
| 2018 | $1,345 | $1,046 | $0 | $0 |
| 2017 | $6,960 | $1,046 | $661 | $385 |
| 2016 | $1,291 | $1,046 | $661 | $385 |
| 2015 | $1,284 | $1,046 | $661 | $385 |
| 2014 | $1,284 | $1,046 | $661 | $385 |
| 2013 | $1,227 | $1,046 | $661 | $385 |
Source: Public Records
Map
Nearby Homes