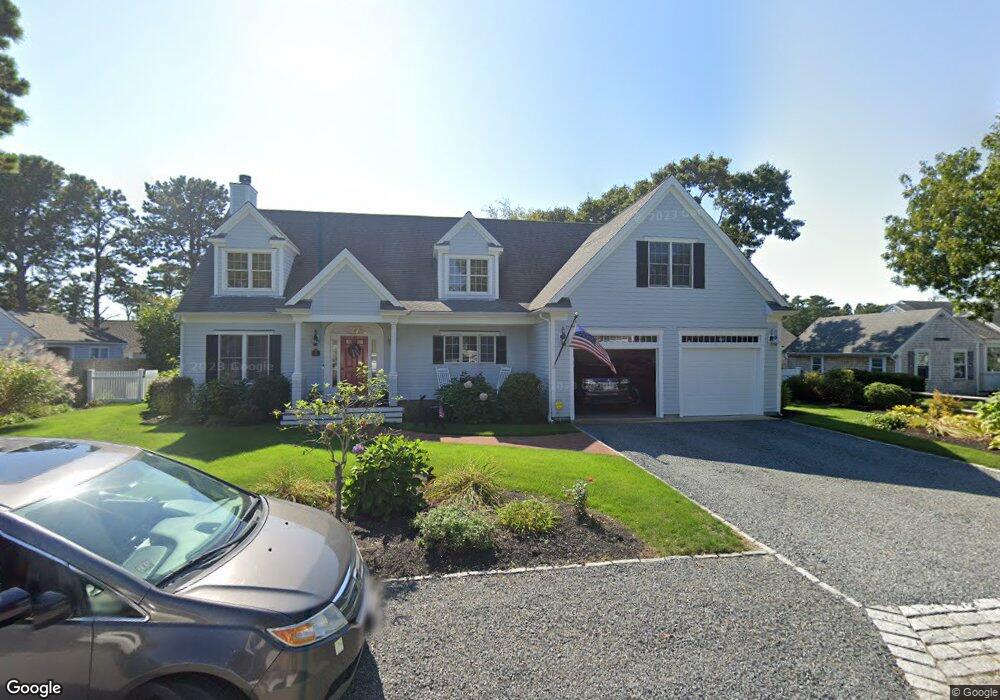
27 Davenport Rd West Dennis, MA 02670
West Dennis NeighborhoodEstimated Value: $1,451,000 - $1,788,225
4
Beds
3
Baths
2,301
Sq Ft
$707/Sq Ft
Est. Value
About This Home
This home is located at 27 Davenport Rd, West Dennis, MA 02670 and is currently estimated at $1,626,556, approximately $706 per square foot. 27 Davenport Rd is a home located in Barnstable County with nearby schools including Dennis-Yarmouth Regional High School and St. Pius X. School.
Ownership History
Date
Name
Owned For
Owner Type
Purchase Details
Closed on
Jan 14, 2016
Sold by
Friel James P and Friel Helen F
Bought by
Helen F Friel T and Friel James P
Current Estimated Value
Purchase Details
Closed on
Feb 15, 2013
Sold by
Friel James P
Bought by
Friel James P and Friel Helen F
Home Financials for this Owner
Home Financials are based on the most recent Mortgage that was taken out on this home.
Original Mortgage
$265,000
Interest Rate
3.38%
Mortgage Type
New Conventional
Create a Home Valuation Report for This Property
The Home Valuation Report is an in-depth analysis detailing your home's value as well as a comparison with similar homes in the area
Home Values in the Area
Average Home Value in this Area
Purchase History
| Date | Buyer | Sale Price | Title Company |
|---|---|---|---|
| Helen F Friel T | -- | -- | |
| Friel James P | -- | -- |
Source: Public Records
Mortgage History
| Date | Status | Borrower | Loan Amount |
|---|---|---|---|
| Previous Owner | Friel James P | $265,000 | |
| Previous Owner | Friel James P | $81,000 |
Source: Public Records
Tax History Compared to Growth
Tax History
| Year | Tax Paid | Tax Assessment Tax Assessment Total Assessment is a certain percentage of the fair market value that is determined by local assessors to be the total taxable value of land and additions on the property. | Land | Improvement |
|---|---|---|---|---|
| 2025 | $6,933 | $1,601,100 | $531,600 | $1,069,500 |
| 2024 | $6,853 | $1,561,100 | $511,200 | $1,049,900 |
| 2023 | $6,675 | $1,429,400 | $464,700 | $964,700 |
| 2022 | $6,187 | $1,104,900 | $376,800 | $728,100 |
| 2021 | $3,962 | $965,500 | $369,400 | $596,100 |
| 2020 | $5,608 | $919,400 | $351,800 | $567,600 |
| 2019 | $4,893 | $793,000 | $344,900 | $448,100 |
| 2018 | $0 | $760,800 | $328,300 | $432,500 |
| 2017 | $0 | $760,800 | $328,300 | $432,500 |
| 2016 | $4,653 | $712,600 | $344,700 | $367,900 |
| 2015 | $4,561 | $712,600 | $344,700 | $367,900 |
| 2014 | $4,284 | $674,700 | $317,400 | $357,300 |
Source: Public Records
Map
Nearby Homes
- 2 Rita Mary Way
- 181 Pleasant St
- 308 Old Main St
- 14 Schoolhouse Ln
- 209 Main St Unit 3
- 209 Main St Unit 6
- 209 Main St Unit 1
- 209 Main St Unit 2
- 209 Main St Unit 4
- 209 Main St Unit 5
- 45 Seth Ln
- 40 Kelley Rd
- 745 Willow St
- 178 School St
- 23 Doric Ave
- 22 Powhatan Rd
- 29 Bass River Rd
- 17 South St
- 15 Sharon Rd
- 18 Turner Ln
- 28 Garfield Ln
- 33 Davenport Rd
- 23 Davenport Rd
- 22 Garfield Ln
- 28 Davenport Rd
- 32 Garfield Ln
- 32 Davenport Rd
- 22 Davenport Rd
- 17 Davenport Rd
- 37 Davenport Rd
- 36 Garfield Ln
- 18 Garfield Ln
- 38 Davenport Rd
- 23 Garfield Ln
- 29 Garfield Ln
- 18 Davenport Rd
- 31 Old Field Rd
- 19 Garfield Ln
- 25 Old Field Rd
- 43 Davenport Rd